Archive:First and second-generation immigrants - obstacles to work
- Data extracted in Month YYYY. Most recent data: Further Eurostat information, Main tables and Database. Planned article update: (dd) Month YYYY(, hh:00).
In 2014, the EU attracted quite a high proportion of highly skilled immigrants[1]. Despite a high level of education [2], two major indicators show difficulties which immigrants[3], especially first-generation immigrants, face on the EU labour market: their unemployment and over-qualification [4] rates are substantially different from native-born residents with native background. In 2014, highly-skilled foreign-born residents in the EU experienced higher unemployment rates than their native-born counterparts[5]. That year, over a third of first-generation immigrants with a tertiary degree worked in a job that required lower educational skills, against around a fifth of native-born residents of foreign and native background [6]. Migration-specific work obstacles like language and communication barriers, lack of recognition of foreign credentials and experience, restricted rights to work, discrimination on social and religious grounds may all contribute to this disconnect.
This article presents the findings of the 2014 Labour Force survey (LFS) ad-hoc module on the respondents’ self-perceived main obstacle to either finding a job which corresponds to their qualifications and experience (for those who reported being over qualified for their current job), or to getting a job at all (for those who did not have a job or business at the time of the survey). Because immigrant-specific obstacles are very different from those that are native-specific, this question was addressed only to first- and second-generation immigrants. The respondents were asked to indicate which of the four migrant-specific work obstacles apply to them. If none applied to them, they could choose between ‘other obstacle’ (apart from the four migration-specific work obstacles mentioned above), ‘no particular obstacle’ and ‘unknown’ (i.e. they encountered work obstacles but could not identify a specific/main one).
Main statistical findings
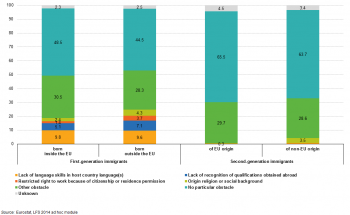
The main finding of the survey is that about half of first-generation immigrants and about two thirds of second-generation immigrants did not mention any particular obstacle to finding a suitable job. About a third of immigrants, regardless of generation and origin, experienced a work obstacle other than the four migration-specific work obstacles analysed in this article.
The four migration-specific work obstacles altogether affected a fifth of first-generation immigrants and 2 % of second-generation immigrants.
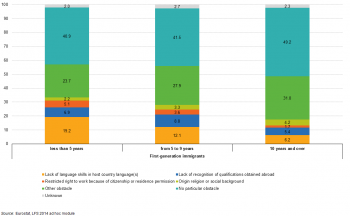
The migration-specific obstacles to finding suitable work are highly correlated to the length of stay in the host country. The higher the number of years spent in the host country, the smaller the proportion of immigrants who experienced a migration-specific obstacle to work. About a third of first-generation immigrants living in the host country for 5 years or less encountered a migration-specific work obstacle, whereas only 1 in 6 of those living in the host country for 10 years or more encountered such an obstacle.
Among those foreign-born residents who mentioned a migration-specific obstacle to finding a job, the lack of language skills was the most cited problem: about 1 in 10 foreign-born residents, irrespective of where they came from, reported encountering language barriers, compared to 1 in every 200 second-generation immigrants. Of the four migration-specific work obstacles analysed, second-generation immigrants of non-EU origin are affected mainly by social and religious discrimination, but to a lesser extent than first-generation immigrants.
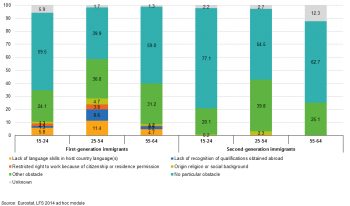
Analysis according to age group reveals that among both generations, people facing one of the four migration-specific work obstacles are concentrated in the core working age group (aged 25-54).
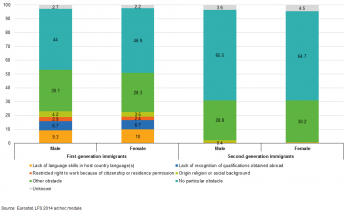
Overall, there is no notable difference between women and men in terms of obstacles at work that result from their migration background.
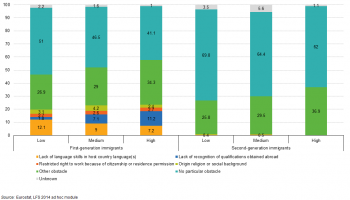
As expected, we note that among first-generation immigrants, the higher the education level, the higher the proportion of those facing difficulty in gaining recognition of their qualifications. However, the higher the education level, the lower the proportion of these immigrants encountering language barriers. Among second-generation immigrants, there is no significant structural difference in the obstacles people experience based on which of the three major educational attainment levels they have reached.
Work obstacles by migration status and migration background
There are substantial differences between first- and second-generation immigrants. As second-generation immigrants have been raised and educated in the host country, they do not face the same obstacles as their immigrant parents or other first-generation immigrants. Therefore, the two generations should be dealt with separately. However, both generations have two things in common. About half of first-generation immigrants and about two thirds of second-generation immigrants did not mention any particular obstacle to finding a suitable job, this being the most common response for both generations. As they are either over-qualified or do not have a job, the findings suggest that they may have little personal motivation to change their situation on the labour market. Also, just under a third of both generations, regardless of having EU or non-EU origins, encountered a work obstacle other than the four migration-specific ones. These other obstacles could refer to
- lack of information about the host country´s labour market,
- lack of contacts or less developed social networks,
- unrecognised work experience or inability to present work experience evidence,
- low applicability of skills acquired abroad,
- little knowledge on local standards and customs,
- other forms of discrimination and so on.
As the analysis from this point on will primarily look at specific difficulties faced by immigrants in finding a suitable job, we will disregard the groups’ responses of ‘no particular obstacle’, ‘other obstacle’, and ‘unknown’. That being said, we note that the lack of language skills was the most common obstacle that prevented first-generation immigrants from finding a suitable job, affecting about 1 in every 10 foreign-born immigrants, irrespective of where they came from.
Regarding the lack of recognition of qualification obtained abroad, the second most common migration-specific work obstacle, it is interesting to note that those first-generation immigrants born outside the EU are more affected than their counterparts born within the EU, which is not surprising given the progress on standardising European degrees under the Bologna system. In any event, the relative difference is small, at 2 percentage points.
Similarly, first-generation immigrants born outside the EU are much more affected by work restrictions as they do not have the same civil and work rights as EU/EEA citizens. Only 1.4 % of EU mobile citizens cited this as their major problem in finding a suitable job, compared to 3.7 % of first-generation immigrants born outside the EU. This small proportion of EU mobile citizens may mostly be made up of citizens from the countries that joined the EU most recently (Romania, Bulgaria and Croatia), who were subject to labour market restrictions in some countries until 2014. However as an obstacle, work restrictions come after discrimination on social and religious grounds, which affect 2.4 % of EU mobile citizens and 4.3 % foreign-born residents of non-EU origin.
Just little over 2 % of first-generation residents encounter obstacles to work but cannot identify a specific/main one.
The situation is very different for second-generation immigrants. Less than 1 % experience language or communication barriers. This could be due to their level of education rather than migration background[7]. However, the fact that 3.5 % of second generation immigrants with at least one parent born outside the EU faced discrimination on social and religious grounds can surely be explained by their migration background. The proportion of second-generation immigrants who encountered obstacles to work without identifying a specific/main one is about twice that of those facing no particular obstacle.
Work obstacles by migration status and age group
Analysis of the different age groups reveals that about three fifths of both young (aged 15-24) and older (aged 55-64) foreign-born workers face no particular obstacle, compared to two fifths of foreign-born workers in the core working age group (aged 25-54).
As for the first-generation immigrants who are in the core working age (aged 25-54) or older workers (aged 55-64), the structural distribution of the four migration-specific obstacles analysed follows the overall pattern: the most common obstacle is the lack of language skills, followed by lack of recognition of qualifications, discrimination on social and religious grounds and restricted right to work. In contrast, young foreign-born workers (aged 15-24) face mainly language or communication problems and to a similar extent problems related to lack of qualifications, work restrictions and social and religious discrimination.
The few second-generation immigrants who face one of the four migration-specific obstacles are concentrated in the core-working age group (aged 25-54). Similarly with first-generation immigrants, mainly younger (aged 15-24) and older workers (aged 55-64) among second-generation immigrants face no particular obstacle.
Work obstacles by migration status and gender
Figure 3 shows that there is no notable difference between men and women when analysing obstacles to work as a result of migration background. The only difference arises when looking at second-generation immigrants encountering social and religious discrimination, where men seem to be somewhat more affected than women. But it is difficult to estimate the extent to which the relative difference is significant given that we see a much higher proportion for those who face obstacles but cannot identify a specific/main one (i.e. unknown).
Work obstacles by migration status and education
Looking at foreign-born residents, we note that the higher the education level, the higher the proportion of those facing difficulty in gaining recognition of their qualifications. However, the higher the education level, the lower the proportion of these immigrants encountering language barriers. Therefore the most common migration-specific work obstacle among first-generation immigrants with high-level education is lack of recognition of qualifications obtained abroad while among those with low-level education the most common obstacle is lack of language skills. Among first-generation immigrants with medium-level education the two obstacles have a similar importance, the relative difference being of 1.8 percentage points in favour of those facing lack of language skills. This situation could be due to the fact that language skills improve with the education level [8], and because of the lower need to recognise foreign qualifications for jobs that do not require higher education.
The social and religious discrimination slightly varies with education level, with the most affected being foreign-born residents with medium-level education. As expected, the work restriction obstacle is not correlated with education. The highest proportion of those who do not experience any work obstacle is seen among first-generation immigrants with low-level education.
Among second-generation immigrants, there is no significant structural difference in the obstacles people experience based on which of the three major educational attainment levels they have reached.
For both generations of all three education levels, the most common response remains ‘no particular obstacle’ followed by ‘other obstacles’. However the differences in proportions are affected by changes in the total proportion of migration-specific work obstacles rather than by the education level itself.
Work obstacles by migration status and length of stay
Work obstacles are mostly correlated with the length of stay in the host country. As Figure 5 shows (and as is to be expected), the longer the number of years spent in the host country, the smaller the proportion of foreign-born residents affected by one of the four migration-specific obstacles. In fact, the total proportion of those facing migration-specific work obstacles is reduced to about half, from 33.3 % for those who have lived in the host country for 5 years or less to 17.5 % for those who have lived there for 10 years or more. The largest decrease is seen for command of the main host country language: only 6.2 % of foreign-born residents who have been living in the host country for 10 years or more still face linguistic barriers, compared to about a fifth of those who arrived during the last 5 years. Work restrictions because of citizenship or residence permits also reduced by 3.3 percentage points. On the other hand, Figure 5 shows that the proportion of foreign-born immigrants facing religious and social discrimination increased by about 1 % for each group, broken down by each category of time spent in the host country.
Data sources and availability
The data collected by Eurostat came from the 2014 Labour Force survey (LFS) ad-hoc module on ‘The labour market situation of immigrants and their immediate descendants’. The target population of the 2014 LFS ad-hoc module consists of all people aged from 15-64 living in private households. The EU totals in the article do not include data for Germany, Denmark, Ireland and the Netherlands as these countries did not participate in the survey.
Context
There is high political and scientific interest in comparative information on the labour market and economic situation of immigrants. This set of comprehensive and comparable data on the situation of immigrants and their immediate descendants is aimed at monitoring progress on the situation of immigrants, to analyse the factors affecting their integration in and adaptation to the labour market and in the economy. The policy background for the 2014 ad-hoc module can be found in the following EU documents:
- The Zaragoza Declaration, adopted in April 2010 by EU Ministers responsible for immigrant integration issues, and approved at the Justice and Home Affairs Council on 3-4 June 2010. The Declaration calls upon the Commission (Eurostat and DG HOME) to carry out a pilot study to study common integration indicators from harmonised data sources.
- ‘EUROPE 2020: A strategy for smart, sustainable and inclusive growth’, outlining three mutually reinforcing objectives of smart, sustainable, and inclusive growth. It has a strong focus on employment, stressing the need for increasing labour market participation, with more and better jobs as essential elements of Europe’s socioeconomic model.
- The Commission Communication of 20 July 2011 on the ‘European Agenda for the Integration of Third Country Nationals’, which focuses on enhancing the economic, social and cultural benefits of migration in Europe and on achieving immigrants’ full participation in all aspects of collective life.
- The Commission Communication of 18 November 2011 on ‘The Global Approach to Migration and Mobility’, which sets out the Commission’s adapted policy framework on migration as part of a renewed Global Approach to Migration and Mobility (GAMM).
- The European Commission has adopted an Action Plan on the integration of third-country nationals on 7 June 2016, which provides a comprehensive framework to support Member States’ efforts in developing and strengthening their integration policies, and describes the concrete measures the Commission will implement in this regard.
See also
- First and second-generation immigrants - a statistical overview
- Migrant integration statistics (online publication)
- Migration and migrant population statistics
- Population and population change statistics
- Statistics for European policies and high-priority initiatives
Further Eurostat information
Data visualisation
Publications
Database
- Labour market (labour)
- Employment and unemployment (Labour Force Survey) (employ)
- LFS ad-hoc modules (lfso)
- 2014. Migration and labour market (lfso_14)
- 2008. Labour market situation of immigrants (lfso_08)
- LFS ad-hoc modules (lfso)
- Employment and unemployment (Labour Force Survey) (employ)
Dedicated section
Methodology / Metadata
This article looks at the first- and second-generation immigrant populations living[9] in the EU and analyses separately those of EU and non-EU background[10]. In this section, the main concepts used in the article are defined.
A ‘first-generation immigrant’[11] is a person born in a country other than her/his country of residence and whose residence period in the host country is, or is expected to be, at least 12 months. A ‘second-generation immigrant’ is a native-born person with at least one foreign-born parent.
In addition to this breakdown by generation, the article looks into differences between people with an EU and a non-EU migration background In this context, the migration background of a first-generation immigrant is based on his/her country of birth as follows:
- ‘EU background’ if the country of birth is in the EU and
- ‘non-EU background’ if it is not.
‘EU mobile citizens’ refers to people born in the EU, who live in another Member State than the one they were born in as a result of the free movement rights granted to EU citizens. Therefore, the terms ‘first-generation immigrant born in the EU’ and ‘EU mobile citizens’ are used interchangeably in this article.
The migration background of a native-born resident is based on the country of birth of her/his parents as follows:
- if neither parent is foreign-born, the native-born resident has a native background.
- If at least one parent is foreign-born, the native-born resident is considered to have an EU background if at least one parent is born in the EU (including in the reporting country), and a non-EU background if both parents are born outside the EU.
Summarising, the migration status of a person together with her/his migration background gives the following five immigrant populations:
- first-generation immigrants born in the EU (or ‘EU mobile citizen’);
- first-generation immigrants born outside the EU (e.g. born in a non-EU country);
- second-generation immigrants of EU origins (e.g. native-born population with at least one foreign parent where at least one parent is born in an EU country, including the reporting one)[12] ;
- second-generation immigrants of non-EU origins (e.g. native-born population with both parents born outside the EU);
- native-born of native background (i.e. native-born population whose parents are both also native-born).
For further details please see 2014. Migration and labour market (ESMS metadata file — lfso_14)
Source data for tables, figures and maps (MS Excel)
Other information
- COM (2004) 811 Green Paper on an EU approach to managing economic migration
- COM (2005) 669 Communication from the Commission — Policy Plan on Legal Migration
- COM (2006) 402 Communication from the Commission on Policy priorities in the fight against illegal immigration of third-country nationals
- COM (2007) 512 Communication from the Commission — Third Annual Report on Migration and Integration
- COM (2008) 611 Communication from the Commission — Strengthening the global approach to migration: increasing coordination, coherence and synergies
- COM (2010) 171 Communication from the Commission — Delivering an area of freedom, security and justice for Europe's citizens — Action Plan Implementing the Stockholm Programme
External links
- European Commission - Home Affairs - Immigration
- European Union Democracy Observatory on Citizenship
- European Web Site on Integration
- Country ranking by Human Development Index (United Nations Development Programme)
- OECD - International migration (feed)
- International Migration Outlook 2013
Notes
- ↑ See the Statistics Explained (SE) article ‘First and second-generation immigrants - statistics on education and skills’.
- ↑ According to the ‘International Standard Classification of Education’ (ISCED11), at the three aggregated levels of educational attainment (i.e. low-, medium- and high-level education).
- ↑ The immigrants’ definition and categories are explained in detail to the chapter 'Methodology / Metadata’.
- ↑ Over-qualification is the state of being skilled or educated beyond what is necessary for a job. The over-qualification rate is the number of over-qualified people as a percentage of the labour force.
- ↑ See SE article 'First and second-generation immigrants - labour market indicators'
- ↑ See SE article 'First and second-generation immigrants - education and skills'
- ↑ See the paragraph ‘Work obstacles by migration status and education’.
- ↑ See SE article First and second-generation immigrants - education and skills
- ↑ The LFS covers the resident population. Furthermore, the concept of ‘usual residence’ is used to define an immigrant. The terms ‘to live’ and ‘to reside’ are used interchangeably in this article.
- ↑ The term ‘background’ refers here to the total of a person’s experience, knowledge and education (see Merriam-Webster dictionary). The ‘migration background’ refers thus to the origins of a person as the main determinant of an immigrant’s experience, knowledge and education. Therefore, the terms ‘background’ and ‘origins’ are synonyms in the context of this article. While the official statistical terminology uses the term ‘background’, in data analysis the term ‘origins’ could be also used to give more fluidity to the text (as the term ‘origin’ is more frequently used in specialist literature and therefore preferred by the general public).
- ↑ For the purpose of this article, the terms ‘first-generation immigrant’ and ‘foreign-born’ are used interchangeably.
- ↑ As a result, those native-born with a mix background but having at least one parent born within in EU and none outside the EU are included in this category (i.e. second generation immigrants of EU origins).
[[Category:<Subtheme category name(s)>|Name of the statistical article]] [[Category:<Statistical article>|Name of the statistical article]]
Delete [[Category:Model|]] below (and this line as well) before saving!
