The percentage change is heavily used when analysing and comparing statistical data over time and percentage points when analysing differences in rates.
Percentage change
When you have data for two points in time, you can calculate how much change there has been during this period. The result is expressed as a percentage (in absolute numbers, it's just a difference) and is called the rate of change, i.e. the percentage change. It is calculated as follows: [(Number at later time ÷ Number at earlier time) - 1] × 100.
Example
In 2010, there were 4.8 million persons employed in country X and in 2015 there were 5.2 million. The percentage change from 2010 to 2015 is then calculated as follows: [(5.2 ÷ 4.8)-1] x 100= +8.3%
Percentage points
The term percentage points is used when comparing two different percentages. The best way to explain this is through an example:
Example
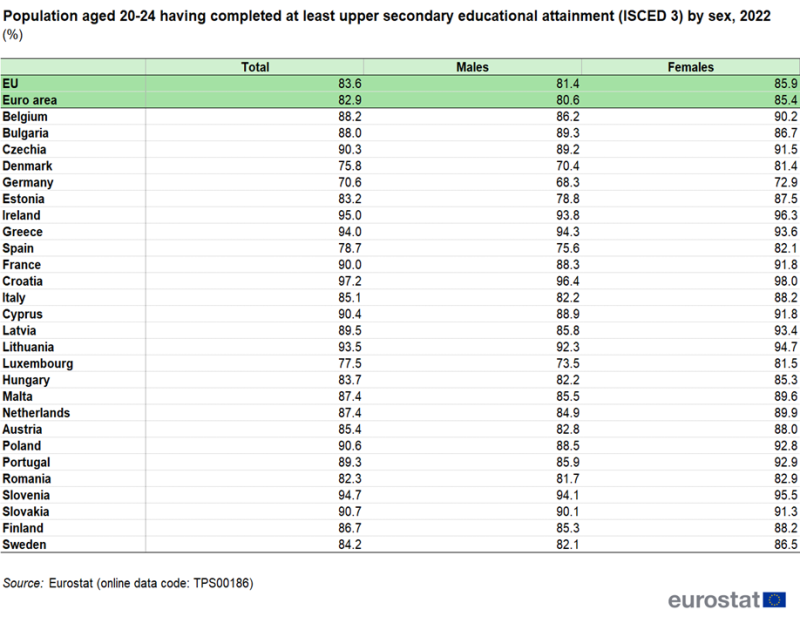
In 2022, the share of those aged 20–24 in the EU having completed at least upper secondary education was 85.9 % for women and 81.4 % for men. The difference of these two percentages is calculated in percentage points: 85.9 % minus 81.4 % = 4.5 percentage points. This means that the share of women with at least upper secondary education was 4.5 percentage points higher than the share of men.
Please see the table below:
Explore further
Visualisation
- Video Croatian Bureau of Statistics Percentage

