Archive:Asia-Europe Meeting (ASEM) - a statistical portrait - education
- Data from July 2014. Most recent data: Further Eurostat information, Main tables and Database.
This article is part of a set of statistical articles based on Eurostat’s publication Asia-Europe Meeting (ASEM) — A statistical portrait.

(% of gross domestic product) - Source: Eurostat (educ_figdp) and the UNESCO Institute for Statistics (UIS)

(% of total government / public education expenditure) - Source: Eurostat (educ_figdp) and the UNESCO Institute for Statistics (UIS)

(USD based on purchasing power parities) - Source: Eurostat (educ_figdp) and the UNESCO Institute for Statistics (UIS)

(% of total number of pupils and students) - Source: Eurostat (educ_ilev) and the UNESCO Institute for Statistics (UIS)

(years) - Source: Eurostat (educ_ilev) and the UNESCO Institute for Statistics (UIS)

(years) - Source: Eurostat (educ_igen) and the UNESCO Institute for Statistics (UIS)

(number) - Source: Eurostat (educ_iste) and the UNESCO Institute for Statistics (UIS)

(per 1 000 population aged 20-29) - Source: Eurostat (educ_grad4) and (educ_igen), the UNESCO Institute for Statistics (UIS) and the World Bank (DataBank)

(% of all graduates) - Source: Eurostat (educ_grad5) and the UNESCO Institute for Statistics (UIS)

(% of total tertiary student population) - Source: Eurostat (educ_momo_gen) and the UNESCO Institute for Statistics (UIS)
This article focuses on education data about the European Union (EU), Norway and Switzerland in comparison with 20 Asian ASEM partners. It covers key indicators concerning expenditure on education, the number of pupils and students, school life and tertiary education.
The use of the term European ASEM partners in this article refers to the 28 Member States of the EU, Norway and Switzerland. The use of the term Asian ASEM partners in this article refers to the 10 members of the Association of Southeast Asian Nations (ASEAN) and the 10 remaining ASEM partners referred to as Northeast and South Asia (NESA).
Main statistical findings
Educational expenditure
Comparisons between countries relating to levels of public expenditure on education are influenced by differences in price levels and by the number of students. In relative terms, public expenditure on education was highest among the ASEM partners in 2011 in Denmark, Malta and Cyprus, where it was close to or above 8.0 % of gross domestic product (GDP), as can be seen in Figure 1. The average for the EU-28 was 5.3 %, a level that was exceeded in five of the Asian ASEM partners. Between 2001 and 2011 public expenditure on education relative to GDP increased in a small majority of ASEM partners, although there were notable reductions in Latvia, Mongolia and Malaysia.
The division of public expenditure on education by level of education (see Figure 2) depends on a number of factors, such as the age structure of younger people, the enrolment rates for different levels of education and the average expenditure per pupil at each level. Among the ASEM partners, the greatest variability in the share of expenditure on a particular level of education in 2011 was observed for pre-primary education. This education level accounted for 11 % of total public expenditure on education in the EU-28, a share that was exceeded by three of the Asian ASEM partners (Thailand, the Russian Federation and Mongolia).
Figure 3 presents data for average public expenditure per pupil or student in education, in 2011, in a common currency (United States dollars) having converted this using purchasing power parities to adjust for price level differences. The cost of teaching tends to increase as a child moves through the education system, with expenditure per pupil/student generally highest in tertiary education and lowest in primary education. Notable exceptions among the ASEM partners were Luxembourg, Poland, Australia, Thailand and Mongolia where expenditure per pupil was highest for primary education.
Pupils and students
There were around 88.6 million pupils in the EU-28 in 2012 within pre-primary, primary, upper secondary and post-secondary non-tertiary levels of education and a further 20.2 million students in tertiary education. Worldwide, the total enrolment in these education levels was just over 1.4 billion pupils and 196 million tertiary education students. Comparing the division of students by education level, the main difference between European and Asian ASEM partners was the higher proportion of primary education students in Asian ASEM partners, particularly in NESA (see Figure 4). Nevertheless, within NESA there were several different situations: the education level structures of pupils and students in the Republic of Korea and the Russian Federation were broadly similar to that in the EU-28, albeit with a higher proportion in tertiary education; the two large populations of China and India had a similar structure to each other and influenced greatly the NESA average, while Pakistan had an even higher proportion of pupils and students in primary education. The two ASEAN members shown in Figure 4, namely Myanmar and Cambodia, stand out because of their low shares of pupils in pre-primary education and students in tertiary education combined with a high share for primary education.
School life
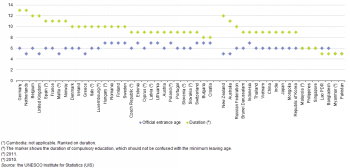
The level of educational enrolment depends on a wide range of factors, such as the age structure of the population, legal requirements concerning the start and end (or duration) of compulsory education, the availability of educational resources and the demand for secondary and tertiary education. In 2012, the earliest starting age for compulsory education among ASEM partners was five years old in four EU Member States, New Zealand, Australia, Myanmar and Pakistan (see Figure 5). The latest age for starting education was seven years old in 10 of the EU Member States, Switzerland and Indonesia. The duration of compulsory education was as high as 13 years in the Netherlands and Germany, while it was at least eight years in most other ASEM partners with shorter durations (five or six years) recorded for five ASEAN members, Pakistan and Bangladesh.
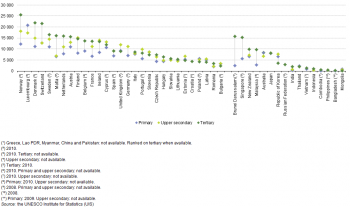
The school expectancy shown in Figure 6 is an indicator of the time that a young person is likely to spend in the education system in practice. The range in school expectancy among European ASEM partners in 2012 was from 14.9 years in Cyprus to 20.5 years in Finland, averaging 17.6 years for the EU-28 as a whole; school expectancy in all EU Member States was above the world average of 13.4 years. The equivalent range for Asian ASEM partners was much broader, from 9.3 years in Pakistan to 21.3 years in Australia; Pakistan, Lao PDR and Bangladesh (2011 data) were the only ASEM partners with a school expectancy below the world average.
Pupil-teacher ratios
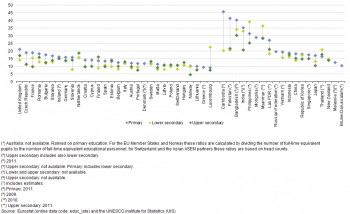
Figure 7 shows the pupil-teacher ratio for primary education as well as lower and upper secondary education among the ASEM partners: for the EU Member States and Norway these ratios are calculated by dividing the number of full-time equivalent pupils by the number of full-time equivalent educational personnel; for Switzerland and the Asian ASEM partners these ratios are based on head counts. In 2012, the average number of pupils per teacher was generally higher for primary education than for secondary education: for the world as a whole the pupil-teacher ratio for primary education was 24.2, whereas it was 18.0 for lower secondary and 15.9 for upper secondary. The main exceptions to this general pattern among ASEM partners were recorded for those partners where the ratios were similar across all three levels of education (such as in Italy, Sweden or Hungary). Otherwise, pupil-teacher ratios in lower secondary education were higher than those in primary education in Luxembourg, the Philippines, Myanmar and Thailand.
Pupil-teacher ratios in European ASEM partners were generally below 20, whereas for Asian ASEM partners nearly half of the ratios were above this level. For each of the three levels of education shown in Figure 7 there were eight Asian ASEM partners with pupil-teacher ratios that were above the world averages. Among the European ASEM partners the only pupil-teacher ratios that were above the world averages were the ratios for upper secondary education in Finland, the United Kingdom and the Netherlands and the ratio for lower secondary education in Luxembourg.
Tertiary education graduates
Universities and other higher education institutions provide tertiary education. When analysing data for individual ASEM partners it is important to remember than in some very small partners, such as Luxembourg and Cyprus, it is common for students to study abroad; this has an impact on many indicators related to tertiary education.
Figure 8 provides an analysis of the number of graduates from tertiary education in 2012 relative to the population aged 20–29. Among the European ASEM partners there were 75.6 tertiary graduates per 1 000 persons aged 20–29. Among the Asian ASEM partners a higher ratio of tertiary graduates to this age group was recorded in the Russian Federation, the Republic of Korea, New Zealand and Australia.
An analysis of tertiary graduates by their field of study in 2012 is presented in Figure 9 for the EU-28, Norway and Switzerland, and a selection of six Asian ASEM partners. Australia reported a higher share of graduates from social sciences, business and law, but otherwise had a similar structure to that for the European ASEM partners. The Republic of Korea and the Russian Federation reported relatively large shares of graduates from science, engineering, manufacturing and construction fields, while Bangladesh, the Republic of Korea and Japan all reported higher shares of graduates from humanities and arts fields than the European ASEM partners. Indonesia reported the largest proportion of graduates from the fields of education and agriculture.
Inbound tertiary student mobility was relatively high in 2012 in several European ASEM partners, particularly those with languages in common with their neighbours (see Figure 10). Among the Asian ASEM partners inbound tertiary students made up relatively large shares of the tertiary student population in Australia and New Zealand as well as in Singapore (where English is also one of the official languages). Worldwide, inbound students make up about 2.0 % of the tertiary student population, a level that was passed by all except five European ASEM partners and just under half of the Asian ASEM partners.
Data sources and availability
The standards for international statistics on education are set by three international organisations: the Institute for Statistics of the United Nations Educational, Scientific and Cultural Organisation; the OECD; and Eurostat.
The indicators presented are often compiled according to international — sometimes global — standards. Although most data are based on international concepts and definitions there may be certain discrepancies in the methods used to compile the data.
Almost all of the indicators presented for the EU (and its Member States), Norway and Switzerland have been drawn from Eurobase, Eurostat’s online database. In exceptional cases some indicators for the EU have been extracted from international sources.
For the Asian ASEM partners and their aggregates (ASEAN and NESA), the data presented have been extracted from the World Bank and the UNESCO Institute for Statistics (UIS).
For many of the indicators multiple international statistical sources are available, each with their own policies and practices concerning data management (for example, concerning data validation, the correction of errors, the estimation of missing data, and the frequency of updating). In general, attempts have been made to use only one source for each indicator in order to provide a comparable analysis between the partners.
Aggregates for ASEM, the European ASEM partners and the Asian ASEM partners have been compiled from the data for individual partners as indicated above. As such, they may combine data from Eurostat and international sources.
Context
The importance of private expenditure on education varies greatly between countries and as such public expenditure does not represent the total expenditure on education. Expenditure includes spending on schools, universities and other public and private institutions involved in delivering educational services as well as providing financial support to students.
Education is regarded as providing a wealth of benefits, such as supporting economic growth, contributing to the personal and social development of pupils and students and helping to reduce inequalities.
See also
- Asia-Europe Meeting (ASEM) — a statistical portrait — online publication
- Asia-Europe Meeting (ASEM) and EU — key statistical indicators
- EU trade and investment statistics with the Association of South East Asian Nations (ASEAN)
- Korea-EU — business demography
- South Korea-EU — trade in goods
- The EU in the world
Further Eurostat information
Publications
- ASEM partners accounted for 44% of EU28 imports and 30% of exports in 2013 — News release October 2014
- EU-South Korea trade relations boosted by the recent free trade agreement — Statistics in focus 1/2015
- EU trade in goods with India in slight deficit in 2015 for a third consecutive year — News release March 2016
- From birth to death: a closer look at business demography in selected EU countries and the Republic of Korea — Statistics in focus 1/2014
- Goods trade with ASEAN countries rebounds from 2009 to 2010 — Statistics in focus 47/2011
- The EU in the world 2013 — A statistical portrait — Statistical book (2013)
- The European Union and the BRIC countries — Pocketbook (2012)
- The European Union and the Republic of Korea — A statistical portrait — Statistical book (2012)
Database
- Education and training, see:
- Education (educ)
- Education indicators - non-finance (educ_indic)
- Context (educ_igen)
- Distribution of pupils/ Students by level (educ_ilev)
- Indicators on education finance (educ_finance)
- Expenditure on education as % of GDP or public expenditure (educ_figdp)
- Enrolments, graduates, entrants, personnel and language learning - absolute numbers (educ_isced97)
- Graduates in ISCED 5 and 6 by age and sex (educ_grad4)
- Graduations in ISCED 3 to 6 by field of education and sex (educ_grad5)
- Student mobility and foreign students in tertiary education (educ_mo)
- Mobile students (educ_momo)
- Students from abroad by level of education and sex (educ_momo_gen)
- Mobile students (educ_momo)
- Education indicators - non-finance (educ_indic)
Dedicated section
Source data for figures (MS Excel)
External links
- ASEM Infoboard – The official information platform of the Asia-Europe Meeting (ASEM)
- European Commission – DG International Development and Cooperation — EuropeAid: Building strong and lasting links with Asia
- European External Action Service (EEAS): European Union involvement in the Asia-Europe Meeting