- Data from September 2009, most recent data: Further Eurostat information, Main tables and Database.
Social protection encompasses all interventions from public or private bodies intended to relieve households and individuals of the burden of a defined set of risks or needs, provided that there is neither a simultaneous reciprocal nor an individual arrangement involved. This article analyzes recent statistics on social protection in the European Union (EU).
Main statistical findings
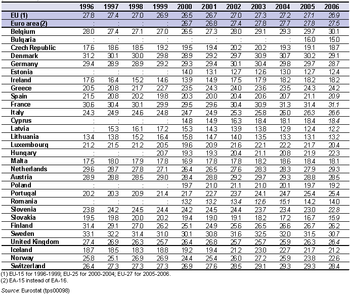
Social protection expenditure in the EU-27 averaged over one quarter (26.9 %) of GDP in 2006. Its share was highest in Sweden (30.7 %) and France (31.1 %), and was higher than 25 % in 11 of the EU-15 Member States. In contrast, social protection expenditure represented less than 20 % of GDP in all of the Member States that have joined the EU since 2004, with the exception of Slovenia and Hungary, with Ireland (18.2 %), as sole 'old' Member State also below this threshold.
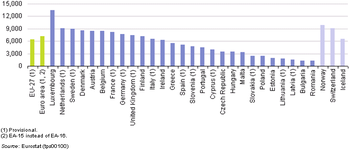
The use of a purchasing power standard (PPS) allows an unbiased comparison of social protection expenditure per capita between countries, taking account of differences in price levels. The highest level of expenditure on social protection per capita in 2006 was registered for Luxembourg (PPS 13 458 per capita), followed some way behind by the Netherlands, Sweden, Denmark, Austria, Belgium and France where social protection per capita was between PPS 8 200 and PPS 9 100. In contrast, expenditure in the Baltic Member States, Bulgaria and Romania was less than PPS 2 000 per capita. These disparities between countries are partly related to differing levels of wealth and also reflect differences in social protection systems, demographic trends, unemployment rates and other social, institutional and economic factors.
Among social protection benefits (the largest component of total expenditure), a majority of the EU-27’s expenditure was directed towards either old age (for example, pensions) or to sickness and healthcare; together these two items accounted for close to 70 % of total EU-27 benefits in 2006. Benefits related to children, disabilities, survivors and unemployment each accounted for shares of between 5 % and 8 % of total expenditure, while housing accounted for 2.3 %.
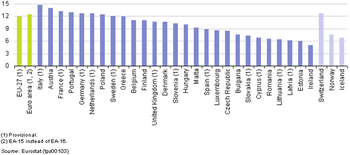
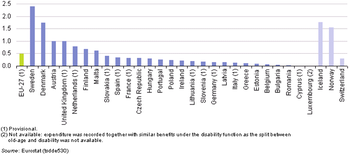
Expenditure on pensions across the EU-27 was equivalent to 11.9 % of GDP in 2006, ranging from a high of 14.7 % in Italy to a low of 5.0 % in Ireland. Expenditure on care for the elderly in the EU-27 accounted for 0.5 % of GDP in the same year, although Sweden reported a rate that was almost five times as high; expenditure on the elderly fell to less than 0.1 % of GDP in Greece, Estonia, Belgium, Bulgaria, Romania and Cyprus.
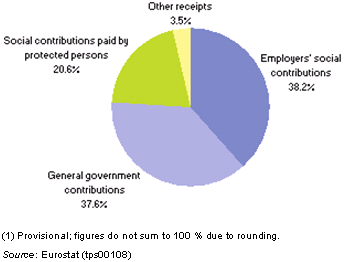
A breakdown of social protection receipts across the EU-27 in 2006 shows that the majority of receipts could be attributed to employers’ social contributions (38.2 %) and general government contributions (37.6 %). Approximately one fifth (20.6 %) of all EU-27 receipts were funded by contributions made by protected persons.
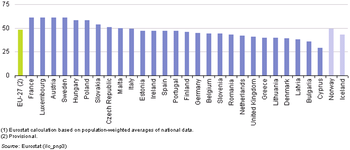
Pension systems can also play a key role in allowing retirees to maintain living standards they previously enjoyed in the later years of their working lives. The aggregate replacement ratio measures the difference between retirement benefits (excluding other social benefits) for pensioners (aged 65 to 74 years old) and salaries received by those aged 50 to 59.
Average pension levels were generally lower than the earnings of those aged 50 to 59 in 2007. This was particularly the case in Cyprus (where pensions represented a little less than 30 % of the earnings among those aged 50 to 59) but also in Denmark, Latvia and Bulgaria (under 40 %). The ratio was highest in France, Luxembourg, Austria and Sweden, but even in these Member States it was only just above 60 %. It should be borne in mind that these relatively low ratios may reflect low coverage and/or low income replacement from statutory pension schemes and maturing pension systems, as well as incomplete careers or an under-declaration of earnings.
Data sources and availability
Data on expenditure and receipts of social protection are drawn up according to the European system of integrated social protection statistics (ESPROS) methodology; this system has been designed to allow a comparison of social protection flows between Member States. In April 2007, a legal basis was established for the provision of ESSPROS data (with data delivery due to start in 2008 with reference to 2006 data); this basis is provided for by Regulation 0458/2007 and was later supplemented by Regulation 1322/2007 and 10/2008; all this information and ESSPROS data can be found on the Eurostat website.
Social interventions are made through collectively organised schemes. Expenditure on social protection includes: social benefits, administration costs (which represent the costs charged to the scheme for its management and administration) and other expenditure (which consists of miscellaneous expenditure by social protection schemes, principally, payment of property income).
Social protection benefits are direct transfers, in cash or in kind, by social protection schemes to households and individuals to relieve them of the burden of one or more of the defined risks or needs. Social benefits are paid to households by social security funds, other government units, NPISHs (non-profit institutions serving households), employers administering unfunded social insurance schemes, insurance enterprises or other institutional units administering privately funded social insurance schemes. Benefits are classified according to eight social protection functions (which represent a set of risks or needs):
- sickness/healthcare benefits – including paid sick leave, medical care and provision of pharmaceutical products;
- disability benefits – including disability pensions and the provision of goods and services (other than medical care) to the disabled;
- old age benefits – including old age pensions and the provision of goods and services (other than medical care) to the elderly;
- survivors’ benefits – including income maintenance and support in connection with the death of a family member, such as survivors’ pensions;
- family/children benefits – including support (except healthcare) in connection with the costs of pregnancy, childbirth, childbearing and caring for other family members;
- unemployment benefits – including vocational training financed by public agencies;
- housing benefits – including interventions by public authorities to help households meet the cost of housing;
- social exclusion benefits not elsewhere classified – including income support, rehabilitation of alcohol and drug abusers and other miscellaneous benefits (except healthcare).
The pensions aggregate comprises part of periodic cash benefits under the disability, old age, survivors and unemployment functions. It is defined as the sum of the following social benefits: disability pension, early-retirement benefit due to reduced capacity to work, old age pension, anticipated old age pension, partial pension, survivors’ pension, early-retirement benefit for labour market reasons. Expenditure on care for the elderly is defined as the percentage of social protection expenditure devoted to old age care in GDP. These expenditures cover care allowance, accommodation, and assistance in carrying out daily tasks. The aggregate replacement ratio is defined as the median individual gross pensions of those aged 65 to 74 relative to median individual gross earnings of those aged 50 to 59, excluding other social benefits; it is expressed in percentage terms.
The schemes responsible for providing social protection are financed in different ways, their social protection receipts comprise social security contributions paid by employers and protected persons, contributions by general government, and other receipts from a variety of sources (for example, interest, dividends, rent and claims against third parties). Social contributions by employers are all costs incurred by employers to secure entitlement to social benefits for their employees, former employees and their dependants; they can be paid by resident or non-resident employers. They include all payments by employers to social protection institutions (actual contributions) and social benefits paid directly by employers to employees (imputed contributions). Social contributions made by protected persons comprise contributions paid by employees, by the self-employed and by pensioners and other persons.
Context
Social protection systems are highly developed in the EU: they are designed to protect people against the risks and needs associated with unemployment, parental responsibilities, sickness/healthcare and invalidity, the loss of a spouse or parent, old age, housing and social exclusion (not elsewhere classified).
The organisation and financing of social protection systems is the responsibility of each of the Member States. The model used in each Member State is therefore somewhat different, while the EU plays a coordinating role to ensure that people who move across borders continue to receive adequate protection. This role also promotes actions among the Member States to combat poverty and social exclusion, and to reform social protection systems on the basis of policy exchanges and mutual learning; this policy is known as the social protection and social inclusion process. The process underpins the revised Lisbon objectives for 2010, promoting a more inclusive Europe that, it is argued, will be vital to achieve the EU’s goals of sustained economic growth, more and better jobs and greater social cohesion.
Further Eurostat information
Publications
- In 2006, gross expenditure on social protection accounted for 26.9% of GDP in the EU-27 - Statistics in focus 40/2009
- European Social Statistics - Social protection Expenditure and receipts - Data 1997-2005
- EU Social Reports
Main tables
- Social protection (t_spr)
- Total expenditure on social protection (tps00098)
- Total expenditure on social protection per head of population. ECU/EUR (tps00099)
- Total expenditure on social protection per head of population. PPS (tps00100)
- Total expenditure on social protection by type (tps00101)
- Total expenditure on social benefits (tps00102)
- Total expenditure on administration costs (tps00104)
- Other expenditure on social protection (tps00105)
- Social benefits by function (tps00106)
- Social benefits per head of population by function (tps00107)
- Expenditure on pensions (tps00103)
- Expenditure on care for elderly (tsdde530)
- Social protection receipts by type (tps00108)
Database
- Social protection (spr)
- Social protection expenditure (spr_expend)
- Expenditure: main results (spr_exp_sum)
- Pensions (spr_exp_pens)
- Expenditure - Tables by functions, aggregated benefits and grouped schemes, in currency (spr_exp_cur)
- Tables by functions, aggregated benefits and grouped schemes - in MIO of national currency (spr_exp_nac)
- Tables by functions, aggregated benefits and grouped schemes - in MIO of EUR (spr_exp_eur)
- Tables by functions, aggregated benefits and grouped schemes - in MIO of PPS (spr_exp_pps)
- Tables by functions, aggregated benefits and grouped schemes - in PPS per head (spr_exp_ppsh)
- Tables by functions, aggregated benefits and grouped schemes - in % of the GDP (spr_exp_gdp)
- Expenditure - Tables by benefits, by function (spr_exp_func)
- Tables by benefits - sickness/health care function (spr_exp_fsi)
- Tables by benefits - disability function (spr_exp_fdi)
- Tables by benefits - old age function (spr_exp_fol)
- Tables by benefits - survivors function (spr_exp_fsu)
- Tables by benefits - family/children function (spr_exp_ffa)
- Tables by benefits - unemployment function (spr_exp_fun)
- Tables by benefits - housing function (spr_exp_fho)
- Tables by benefits - social exclusion n.e.c. function (spr_exp_fex)
- Tables by benefits - all functions (spr_exp_fto)
- Social protection receipts (spr_receipts)
- Receipts by type (spr_rec_sumt)
- Receipts by sector of origin (spr_rec_sums)
- Receipts - Tables by sector of origin and type, in MIO of national currency (including 'euro fixed' series for euro area countries) (spr_rec_nac)
- Receipts - Tables by sector of origin and type, in MIO of EUR (spr_rec_eur)
- Receipts - Tables by sector of origin and type, in % of the GDP (spr_rec_gdp)
- Social protection expenditure (spr_expend)
Dedicated section
Other information
- Regulation 458/2007 of 25 April 2007 on the European system of integrated social protection statistics (ESSPROS)
- Regulation 1322/2007 of 12 November 2007 implementing Regulation 458/2007 as regards the appropriate formats for transmission, results to be transmitted and criteria for measuring quality for the ESSPROS core system and the module on pension beneficiaries
- Regulation 10/2008 of 8 January 2008 implementing Regulation 458/2007 as regards the definitions, detailed classifications and updating of the rules for dissemination for the ESSPROS core system and the module on pension beneficiaries
- ESSPROS Manual - 1996
- ESSPROS Manual - 2008

