Archive:Statistics on European cities
- Data extracted in March 2015. Most recent data: Further Eurostat information, Main tables and Database. Planned article update: June 2016.
Maps can be explored interactively using Eurostat’s Statistical Atlas (see user manual).
This article is part of a set of statistical articles based on the Eurostat regional yearbook publication. It presents data on European Union (EU) cities: the first part relates to demographic developments, with information pertaining to the resident population, an analysis of age structures and statistics on the citizenship of EU city dwellers; the second part provides information on housing, analysing the disparities observed in terms of the average size of households, the average price of houses, the proportion of lone parent households, and the proportion of lone pensioner households. These indicators are just a few examples of the wide range of data that is collected by Eurostat on cities.
_(inhabitants)_RYB15.png)
(inhabitants)
Source: Eurostat (urb_cpop1)
Main statistical findings
_(%25_of_total_population)_RYB15.png)
(% of total population)
Source: Eurostat (urb_cpopstr)
_(%25,_persons_aged_65_years_persons_aged_20%E2%80%9364_years)_RYB15.png)
(%, persons aged ≥ 65 years / persons aged 20–64 years)
Source: Eurostat (urb_cpopstr) and (urb_cpop1)
_(%25,_persons_aged_65_years_persons_aged_20%E2%80%9364_years)_RYB15.png)
(%, persons aged ≥ 65 years / persons aged 20–64 years)
Source: Eurostat (urb_cpopstr) and (demo_pjangroup)
_(%25_of_total_population)_RYB15.png)
(% of total population)
Source: Eurostat (urb_cpopcb) and (urb_cpop1)
_(%25_of_total_population)_RYB15.png)
(% of total population)
Source: Eurostat (urb_cpopcb) and (urb_cpop1)
_(%25_of_total_population)_RYB15.png)
(% of total population)
Source: Eurostat (urb_cpopcb)
_(persons)_RYB15.png)
(persons)
Source: Eurostat (urb_clivcon) and (ilc_lvph01)
_(EUR)_RYB15.png)
(EUR)
Source: Eurostat (urb_clivcon)
_in_European_cities,_2012_(%C2%B9)_(%25_of_all_households)_RYB15.png)
(% of all households)
Source: Eurostat (urb_clivcon) and (ilc_lvph02)
_households_in_European_cities,_2012_(%C2%B9)_(%25_of_all_households)_RYB15.png)
(% of all households)
Source: Eurostat (urb_clivcon) and (ilc_lvph02)
Built-up areas — defined as cities, towns and suburbs — provide a home to almost three quarters (72.4 %) of the EU-28’s population. As shown in this article, the quality of urban life in the EU is considered to be crucial for attracting and retaining a skilled labour force, businesses, students and tourists. However, the social and economic concentration of resources in cities can result in undesirable side-effects: for example, congestion or crime. Cities are therefore seen as both the source of and solution to economic, environmental and social challenges and, as such, they may be viewed as being central to achieving the Europe 2020 goals of ‘smart, sustainable and inclusive growth’.
Defining cities and functional urban areas
In 2011, work carried out by the European Commission’s Directorate-General for Regional and Urban Policy (DG REGIO), Eurostat and the OECD resulted in a harmonised definition of cities and their surrounding areas.
- A city consists of one or more local administrative unit (LAU) where the majority of the population lives in an urban centre of at least 50 000 inhabitants (previously known as the core city).
- A greater city is an approximation of the urban centre when this stretches beyond the administrative city boundaries (previously referred to as the kernel).
- A functional urban area consists of the city and its surrounding commuting zone (previously known as a larger urban zone (LUZ)).
An example: three different spatial levels for the city of Dublin (Ireland)
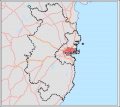
City
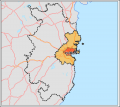
Greater city

Functional urban area


As a result, the information presented in this article has been adapted to reflect the most appropriate definitions. The city statistics that follow are therefore sometimes based on greater cities, reflecting those cases where a relatively high share of the population lives outside of the administrative boundaries of the urban centre (for example, Athens), and those cases where several towns and cities have morphed into one greater city (for example, the greater city of Porto, which is made-up of five cities — Porto, Gondomar, Matosinhos, Valongo and Vila Nova de Gaia).
Demography
Number of inhabitants
Across the EU there is a diverse mix of cities: at one end of the scale are the global metropolises of London and Paris, while approximately half of the cities in the EU had a relatively small urban centre of between 50 000 and 100 000 inhabitants. Many of the EU’s largest cities (especially capitals) attract both internal and external migrants and their population numbers therefore tend to increase at a faster pace than national averages. This often implies a process of urban sprawl, as previously rural areas in the neighbourhood of expanding urban areas are developed to accommodate the growing population.
The distribution of cities across Nordic regions, France and the interior regions of Portugal and Spain was relatively sparse
One of the most striking aspects of the distribution of cities across the EU is the close proximity of cities to each other: this can be seen over much of Belgium, the Netherlands, western parts of Germany, northern Italy and the southern half of the United Kingdom. By contrast, the Nordic Member States, France and the interior of Spain and Portugal (as well as Turkey) were characterised by a more sparse distribution of cities over a greater area.
These differences in spatial distribution may reflect levels of centralisation. On one hand, there are countries like France which appear to have a relatively monocentric structure based on Paris. This may be contrasted with the polycentric structure observed in Germany, where there is no single dominant city.
Almost 10 million inhabitants in Istanbul …
Map 1 presents the resident population of cities as of 1 January 2012: the size of each circle reflects the number of inhabitants of each city. Note that the map mixes concepts to capture the full extent of all urban areas (for details of coverage, see Map 1). On the basis of the data presented, the most populous cities in the EU in 2012 were London (8.3 million inhabitants) and Paris (6.7 million inhabitants in 2011); note that these data refer to the concept of the greater city. The next largest city in the EU was Berlin (3.5 million), while Napoli, Milano, Barcelona and Madrid each reported 3.1–3.2 million inhabitants; there were also large populations in the Turkish cities of Istanbul (almost 10 million inhabitants) and Ankara (3.4 million inhabitants) — note that these data refer to 2004. At the other end of the range, the smallest capital city in the EU was Luxembourg, which had 111 thousand inhabitants (data are for 2015).
… while the functional urban areas of Paris and London each had around 12 million inhabitants
An extended analysis based on the number of inhabitants living in functional urban areas in 2012 shows that the largest populations in the EU were recorded in London and Paris (12.2 and 11.8 million inhabitants; data for Paris relate to 2011), followed — at some distance — by Madrid (6.6 million). The next largest concentration was the urban agglomeration of the Ruhrgebiet in Germany (which includes, among others, Bochum, Dortmund, Duisburg, Essen and Oberhausen) with 5.1 million inhabitants, while the functional urban area of the German capital of Berlin also had a population of just over 5 million persons. There were four functional urban areas with between 4 and 5 million inhabitants, all of which were located in the southern EU Member States, namely, Athina (data are for 2009), Roma, Milano and Barcelona.
Age structure
Figure 1 shows an example of how the age structure of the population varies across cities in the EU. It provides a comparison of the age structure for eight EU Member States and compares this with similar information for each of their capital cities. The figure is split into two parts identifying those capital cities where the population aged 20–54 accounted for a relatively high share of the total population and those where the elderly accounted for a relatively high share.
Younger and middle-aged adults generally drawn to capital cities
The existence of greater opportunities for higher education and employment offered by most capital cities might lead to the assumption that capital cities have a higher share of younger and middle-aged adults. Indeed, among those capitals shown in Figure 1, the share of persons aged 20–54 in the total population peaked in the Danish capital of København, at 61.6 % (compared with a national average of 45.9 % in 2013). In 2012, the younger and middle-aged adult populations of Amsterdam and Helsinki / Helsingfors accounted for between 7 and 8 percentage points more of the total population than their respective national averages, while the difference in Sofia was almost 6 percentage points. There were however some exceptions to this rule, as the proportions of younger and middle-aged adults living in Warszawa, Lisboa (data are for 2013) and Bratislava were lower than the respective national averages for Poland, Portugal and Slovakia.
One hundred cities across Italy and Germany with an old-age dependency ratio of at least 35 %
It is conceivable that older persons (aged 65 and over) might be tempted to move away from capital cities for their retirement to avoid some of the perceived disadvantages often associated with big cities, such as congestion and crime. However, in Madrid, Warszawa, Lisboa and Bratislava, elderly persons accounted for a higher proportion of the total population than the national average.
SPOTLIGHT ON THE REGIONS
Fréjus, France

The French town of Fréjus, which is situated in Provence on the Côte d’Azur, had the highest old-age dependency ratio (58.0 %) of any town /city in the EU-28. In 2011, there were less than two persons aged 20–64 years who were resident in Fréjus for each person aged 65 years or above. The only other towns / cities with old-age dependency ratios of more than 50 % were located just over the border in Liguria on the Italian Riviera, with ratios of 51.2 % in Savona and 52.1 % in Sanremo (data are for 2012).
©: Christian Musat / Shutterstock.com
The ratio between the number of older persons and those aged 20–64 is sometimes referred to as the old-age dependency ratio, and this is shown in Map 2. In 2012, the majority of the cities with an old-age dependency rate of 35 % or more (as shown by the darkest shade in the map) were located in Italy and Germany; together, these two Member States counted 100 such cities.
Aside from Germany, the distribution of these cities with relatively high old-age dependency ratios was often close to a coastline (including popular retirement destinations), with particularly high concentrations on the Italian Adriatic coast and the Mediterranean coast from southern France into northern Italy.
In 2012, there were only three cities in the EU where the old-age dependency ratio exceeded 50 % and all three of them were located on the Mediterranean coast. The highest old-age dependency ratio was recorded in the French resort of Fréjus (58.0 %; data are for 2011), while the other two cities were located just over the border in the Italian towns of Sanremo and Savona. However, the French and Italian Riviera was not the only coastal region that seemingly attracted retirees, as relatively high old-age dependency ratios (of at least 40 %) were recorded elsewhere on the coasts of France (Bayonne and Toulon), Spain (Ferrol in Galicia and Torrevieja on the Costa Blanca), the United Kingdom (Waveney in Suffolk, Eastbourne and Torbay (both on the south coast)) and Belgium (Oostende).
The largest cities with a population of at least 500 thousand inhabitants and an old-age dependency rate of at least 35 % included: the Italian cities of Roma, Milano, Torino and Genova; Nice in the south-east of France (data are for 2011); the German city of Essen in the Ruhr valley; and the Portuguese capital of Lisboa (data are for 2013).
Relatively few old persons living in satellite cities around the Spanish and French capitals
In 2012, there were only four cities across the whole of the EU with at least 500 thousand inhabitants and an old-age dependency ratio that was less than 20 % (as shown by the lightest shade in Map 2). Each of these was a capital city, namely København, Amsterdam, Dublin and London; they were joined by 10 Turkish cities (including Ankara, Istanbul and Izmir) and the Norwegian capital of Oslo.
In 2012, the lowest old-age dependency ratio in a city in the EU was 9.2 % in the southern Romanian city of Slatina, while two suburban areas close to Madrid — Fuenlabrada and Parla — had the second and third lowest ratios (9.8 % and 10.6 %). This pattern of relatively low old-age dependency ratios observed for suburban areas around the Spanish capital extended to Coslada, Las Rozas de Madrid and Torrejón de Ardoz (all of which reported rates of less than 15 %) and was repeated around the French capital, as the cities of Marne la Vallée, Cergy-Pontoise and Saint-Quentin en Yvelines (which are all situated within a radius of no more than 20 km from central Paris) also recorded old-age dependency ratios that were below 15 %.
Several reasons may underlie these patterns: young people may be unable to afford to buy or rent in city centres (especially in capital cities) and instead choose to live in the surrounding suburbs, while families may choose to move to the suburbs to have more living space, and older people might move out of the suburbs to retire to the countryside or the coast.
A low proportion of the elderly were living in cities in Bulgaria, Denmark, Croatia, Cyprus, Luxembourg and Romania
Figure 2 provides an alternative analysis of the range of old-age dependency ratios across cities. It confirms that the elderly generally tended to preferred or chose to live outside the EU’s capital cities. There were some exceptions, with relatively high old-age dependency ratios in Madrid, Warszawa, Lisboa and Bratislava, while the old-age dependency ratios of three other capitals, Praha, Roma and Ljubljana, were also above their respective national averages.
In Bulgaria, Denmark, Croatia, Cyprus, Luxembourg and Romania, the national average for the old-age dependency ratio was above the range shown for all cities: in other words, each of these EU Member States was characterised by a relatively low share of its elderly population living in cities; this was also the case in Norway.
Native and foreign-born populations, national and non-national citizens
The free movement of EU nationals within the Union, unrest in a number of neighbouring countries around the EU, migrant flows and asylum seekers are just some of the many reasons why cities in the EU have become more culturally and ethnically diverse. Indeed, most EU cities have seen their share of non-nationals grow in recent decades.
Map 3 analyses the share of the total population that are native-born, in other words, those persons born in the same Member State for which the data are reported, irrespective of their citizenship; note that there are no data available for several of the EU Member States (including Denmark, Greece, Croatia, Italy, Cyprus, Luxembourg, Malta, most cities in the Netherlands, Austria, Romania and Slovakia).
The share of the native-born population in the total number of inhabitants was relatively low in a band of cities running from the Baltic Member States, through the capitals of the Nordic Member States, across most of Germany into Switzerland and southern France, before finishing on the eastern and southern coasts of Spain. To the north and west of this band, there were a number of major cities in Ireland, France and the United Kingdom where the native-born population accounted for a relatively low share of the total population, while to the south and east of this band the share of the native-born population was high in almost every city.
Bulgarian and Polish cities were often populated almost entirely by native-born inhabitants
There were 112 cities in 2012 where at least 95 % of the population was native-born. In every one of the Bulgarian and Polish cities shown in Map 3 the share of the native-born population was at least 95 %, while in Hungary all but one of the cities shown reported a similarly high share. In absolute terms, there were 33 cities in Poland, 22 in the United Kingdom and 18 cities in Bulgaria where the native-born population accounted for at least 19 out of 20 residents; this was also the case in 7 or 8 cities from each of Spain, France and Hungary.
There were only three relatively large EU cities (with a population of at least 500 000 inhabitants) where the share of the native-born population rose above 95 %: the Bulgarian capital of Sofia (98.1 %) and the two Polish cities of Lódz and Poznan (both 98.8 %). By contrast, there were eight cities in the EU with in excess of 500 000 inhabitants where more than 25 % of the population had been born in another country: four German cities (Frankfurt am Main, München, Nürnberg and Stuttgart), three capital cities (Bruxelles / Brussel, Amsterdam and London) and the Belgian city of Antwerpen; this was also the case in the Swiss city of Zürich. In London, the largest city in the EU, less than two thirds (63.3 % in 2011) of the population was native-born.
SPOTLIGHT ON THE REGIONS
Luxembourg, Luxembourg

The share of foreign citizens in the total population of Luxembourg city was close to two thirds in 2009. Nationals accounted for 36.2 % of the resident population, which was the lowest proportion for any city in the EU-28. Indeed, there were only three towns / cities across the whole of the EU where less than half the population was composed of nationals; the other two being Narva, the third largest city in Estonia (which is located close to the Russian border) and Torrevieja, a coastal city in south-east Spain on the Costa Blanca (that is popular place for foreign citizens to retire).
©: Copyright: INTERPIXELS / Shutterstock.com
Some coastal resorts in Spain were inhabited by a high proportion of people born in other EU Member States
Looking in more detail, Torrevieja, a Spanish coastal resort located on the Costa Blanca to the south of Alicante, was the only city in the EU to report that less than half (44.8 % in 2012) of its total number of inhabitants were native-born — largely due to a relatively high number of inhabitants born in other EU Member States (principally, the United Kingdom, Germany and the Nordic Member States).
It is interesting to note that a similar pattern was repeated on the same coast, to the north of Alicante, in Benidorm (37.1 % of the population was born outside of Spain) and in the more southerly Spanish coastal resorts of Fuengirola, Marbella and Torremolinos (all on the Costa del Sol); these were the only Spanish cities where more than 30 % of the population was born in another country, with the bulk of their inhabitants coming from other, more northerly, EU Member States.
Outside of Spain, there were just two other cities in the EU where the share of the population born outside the reporting Member State was higher than 40 % in 2012. The first of these was the Estonian city of Narva that is located on its eastern border with Russia, where (according to population and migration statistics) most non-native-born people were from Russia, Belarus or Ukraine. The other was the Belgian capital of Bruxelles / Brussel, where those born abroad principally originated from other EU Member States (France, Italy, Spain, Poland and Romania) or from Morocco, Turkey and sub-Saharan former colonies (the Democratic Republic of the Congo, Rwanda and Burundi). Among the non-member countries presented in Map 3, there were three Swiss cities — Genève, Lausanne and Lugano — where close to half of the population was not native-born.
Nationals accounted for just over one third of the population of Luxembourg city …
Map 4 provides a contrasting analysis, namely, the share of the total population who are nationals (in other words, those who have the citizenship of the Member State in which they live). The division between national and foreign citizens depends, at least to some degree, on the inclination or possibility for foreign citizens to take the citizenship of the Member State they are living in.
In Luxembourg city, nationals accounted for just over one third (36.2 %) of the total population in 2009, which was the lowest share among any of the cities for which data are available. There were two other cities where less than half of the population were nationals, namely, Narva (in Estonia) and Torrevieja (in Spain), while Derry (in Northern Ireland in the United Kingdom) had the fourth highest share of non-nationals (54.4 % in 2011, with its foreign population being predominantly of Irish citizenship).
Subject to data availability, there were only three cities with more than 500 000 inhabitants where nationals accounted for less than 75 % of the population in 2012 and they were: the Belgian and Latvian capitals of Bruxelles / Brussel and Rīga (data are for 2011) and the Swiss city of Zürich. Russians made up the largest group of non-Latvian citizens living in Rīga, followed by smaller proportions of citizens from Belarus, Ukraine and the other Baltic States.
… but for 95 % or more in Sofia, Vilnius, Bratislava and Budapest
Figure 3 provides a more detailed analysis of the breakdown of foreign citizens in capital cities (note that a range of different reference years are used). It confirms that more than 95 % of the populations in Sofia, Vilnius, Bratislava and Budapest were composed of national citizens. By contrast, there were only four EU capital cities where the share of nationals was below 80 %, namely, London (78.4 %), Rīga (73.9 %), Bruxelles / Brussel (66.2 %) and Luxembourg (36.8 %).
Figure 3 also shows an analysis of non-national populations, for those with the citizenship of another EU Member State and those who were citizens of non-member countries. There were five capital cities where non-EU nationals accounted for slightly more than one in ten of the population, namely, Berlin, London, Madrid, Wien and Bruxelles / Brussel. However, by far the highest share (25.5 %) of foreign citizens from outside of the EU was recorded in Rīga; this latter figure is principally due to a high number of recognised non-citizens who are mainly former Soviet Union citizens, permanently resident in Latvia although they have not acquired any other citizenship.
More than half of all the inhabitants of Luxembourg city were citizens of another EU Member State
A majority (53.5 %) of the population in Luxembourg was composed of foreign citizens from other EU Member States. The next highest share of EU nationals was recorded in Bruxelles / Brussel, at just over one in five (20.3 %) of the population; these relatively high figures may, at least in part, be explained by both Luxembourg and Bruxelles / Brussel being home to various EU institutions. Otherwise, London (11.2 %) was the only other capital city within the EU-28 to report that more than 10 % of its population was made-up of nationals from other EU Member States; a similar share was recorded in the Swiss capital of Bern, where 11.3 % of the inhabitants were EU nationals.
Housing
The EU does not have any specific responsibilities with respect to housing; rather, national governments develop their own policies. Nevertheless, many of the EU Member States face similar challenges: for example, how to renew housing stocks, how to plan and combat urban sprawl, how to help young and disadvantaged groups get into the housing market, how to promote sustainable development, or how to promote energy efficiency among homeowners.
Average size of households
The average size of dwellings across EU Member States reflects, at least to some degree, population density and housing concentration, but may also be influenced by variations in the price of land and housing, income distribution, as well as the housing stock available for rent or for purchase. Housing in rural areas tends to be larger (in terms of land area and floor space) than housing in cities.
Demographic changes and increased population mobility have resulted in a lower average number of persons per household. If these developments continue in the coming years this will be reflected in the further dissolution of traditional family structures, an increasing proportion of elderly people, and even more fragmented populations, thereby creating demand for a higher number of (smaller) dwellings, despite little or no change in overall population numbers.
The largest households were in Slovakia, where each household was composed of an average of 3.1 persons
Households in the EU-28 were composed of an average of 2.4 persons. In those Member States that joined the EU in 2004 or more recently, average household size tended to be somewhat larger and this pattern was also apparent in most of southern EU Member States. By contrast, the smallest average household sizes were often found in northern and western Member States (Ireland being an exception to this pattern). Among the Member States, the average size ranged from highs of around three persons per household in Slovakia, Bulgaria, Malta and Romania, down to close to two persons in the Nordic Member States, Estonia and Germany.
The disparities in the average size of households between the cities within each EU Member State were generally quite narrow. The widest dispersion was among Italian, Spanish and French cities. For example, in Italy the lowest average household size was in the northern city of Milano (1.7 persons per household in 2012), while in the southern cities of Matera (Basilicata) and Barletta (Puglia) the average size of each household was 2.9 persons.
Figure 4 shows that the national average for the number of persons per household was higher than in any of the cities in Ireland, Luxembourg, Slovenia, Hungary, Belgium, the Czech Republic and Austria, indicating that in each of these Member States the average number of persons per household was higher outside of cities.
Some of the EU’s biggest cities had a relatively low average number of persons per household. Indeed, using this measure among the cities shown, capitals recorded the smallest average household sizes in Slovakia, Poland, Ireland, Greece, Portugal, Luxembourg, Latvia, Lithuania, Hungary, Belgium, the Czech Republic, France, Austria, Denmark and Estonia; this was also the case in Norway. In the remaining EU Member States — those where the capital city did not record the lowest average household size among the cities shown — the average number of persons per household in capital cities remained consistently below the national average.
The average number of persons per household fell to 1.7 in the German capital
Berlin had the lowest average household size among EU capital cities, with each household composed, on average, by 1.7 persons. There were a number of other capitals where households were composed of less than two persons on average, namely, Paris, Roma, Luxembourg city and Helsinki / Helsingfors; this was also the case in Oslo.
Average price of houses
For those who decide to buy a home, it is likely to be the single, most expensive purchase that they make during the course of their lives, while for those who rent, housing often accounts for a substantial share of their monthly expenditure. Homes are highly durable but require extensive financial and material investment to build and maintain, such that property owners in the EU often have a considerable amount of their personal wealth invested in ‘bricks and mortar’.
Figure 5 shows the considerable range of average house prices across EU cities. In 2012, it was in some cases possible to purchase a house for an average of less than EUR 100 000, while the average price of a house in several capitals was nearer to EUR 500 000.
Nationally, the average price of a house in Lithuania, Finland and Sweden (as well as Norway), was lower than the average price in any of the cities shown; this indicates that the average price of houses outside of cities in these northern Member States was lower than the price of houses in cities.
Particularly high house prices in capital cities
House prices were generally highest — for most EU Member States — in their capital city. This was particularly true in the Czech Republic, where the average price of a house in Praha (EUR 894 000) was almost five times as high as the national average; note that these figures are estimated and based on a limited sample. It was more typical to find house prices in capital cities around twice as high as national averages.
Subject to data availability, there was only one EU Member State — Spain — where the average price of a house in the capital city was lower than the national average. Note however that the highest house prices in Spain were registered in a group of satellite cities to the north of the Spanish capital, in the suburbs of Las Rozas de Madrid, Majadahonda and Alcobendas.
Spain was one of four EU Member States (for which data are available) where the average house price in the capital was lower than the price in at least one other city in the same Member State. In Germany, the highest average prices were in München (EUR 810 000), while Düsseldorf, Frankfurt am Main, Heidelberg, Konstanz, Stuttgart and Wiesbaden all registered average house prices over EUR 500 000. These prices were all considerably higher than in the German capital, as the average price of a house in Berlin was EUR 300 000. In Poland there were also several cities that reported average house prices above those recorded for Warszawa: among these, the highest average price of a house was recorded in the northerly city of Gdansk. In Finland there was a single city that recorded average house prices above those recorded in the capital, namely Espoo / Esbo (the second largest city in the country, just to the west of Helsinki).
Lone parent households
Across the EU, one of the main driving forces behind the fall in the average size of households has been the growing number of people living alone and the increasing share of single parent families. This may be linked to a wide range of factors, including: people seeking more independence; increased workforce mobility; a reduction in the longevity of relationships (including higher divorce rates); women generally outliving their partners; and changes in healthcare which allow a greater proportion of the elderly to live (alone) into very old age.
Lone parent households accounted for 4.1 % of all households in the EU
According to EU statistics on income and living conditions (EU-SILC), in 2012, single persons with dependent children accounted for just over 4 % of the total number of households in the EU-28.
Figure 6 shows the distribution of lone parent households with children aged less than 18 across cities. The share of lone parent households in capital cities was generally slightly higher than the national average: the biggest differences were recorded in Italy and the Netherlands. By contrast, in the French, Austrian and Greek capitals, the proportion of lone parent households was lower than the national average as was also the case in Norway.
Figure 6 also shows that the proportion of lone parent households at a national level was often at the bottom end of the range for each EU Member State, sometimes below all values recorded for any of the cities, suggesting that a lower proportion of the rural population was living in lone parent households.
Lone parent households were relatively common in several Belgian, French and British cities, where they accounted for more than 10 % of all households. The highest shares in Belgium were recorded in the Walloon region for the cities of Charleroi, Liège and Namur, and in the capital city. Aside from Fort-de-France (the capital of Martinique in the Caribbean), there were three French cities where lone parent households accounted for more than 10 % of all households: each of these was located in the suburbs around Paris (Saint Denis and communauté d’agglomération Val de France to the north; and communauté d’agglomération des Lacs de l‘Essonne to the south). In the United Kingdom the prevalence of lone parent households was particularly high in and around London, as well as in Birmingham, Liverpool and Middlesbrough, and three cities from Northern Ireland (Derry, Belfast and Lisburn).
Lone pensioner households
According to EU statistics on income and living conditions, in 2012, some 5.6 % of households in the EU-28 were composed of a single person aged 65 years and over. This value is quite low when compared with the information presented in Figure 7 which is based on the proportion of lone pensioners (irrespective of their age); as such, some of the differences may be attributed to people retiring ‘early’, for example, out of choice or because of ill-health.
Women tend to account for a much higher share of the elderly living alone, in part due to their longevity. Indeed, differences in life expectancy between the sexes may explain why some EU Member States have a relatively high proportion of their elderly populations living alone.
The share of lone pensioner households peaked at 15 % or more in Italy, Denmark, Sweden, Croatia, Bulgaria, Lithuania and Estonia. By contrast, retired persons living alone accounted for less than 1 in 10 households in Greece, Spain, Cyprus and Ireland.
The share of lone pensioner households was relatively high (compared with respective national averages) in the capital cities of Portugal, Poland, the Netherlands and Hungary. An analysis of cities with more than 100 000 households shows that the highest proportion of lone pensioner households was recorded in the Italian city of Napoli (data are for 2008), with more than one in four households (26.1 %) occupied by a lone pensioner. Subject to data availability, there were six cities where the share of lone pensioner households stood within the range of 17.5 %–20 %. Of these, three more were Italian cities (Genova, Venezia and Roma), two were southern French cities (Toulon and Nice, already noted as popular retirement destinations), and the final city was Chemnitz (in eastern Germany). By contrast, in the capital cities of Denmark, Lithuania and Luxembourg, the proportion of lone pensioner households was considerably lower than the national average; this was also the case in Norway.
The national average for the share of lone pensioner households was lower in Austria, Hungary, Slovenia and Malta than the shares recorded for any of their cities, suggesting that areas outside of cities were characterised by a lower proportion of lone pensioner households.
Data sources and availability
Cities (Urban Audit)
Eurostat’s data collection on cities (the Urban Audit) is undertaken by the national statistical authorities, the Directorate-General for Regional and Urban Policy (DG REGIO) and Eurostat. It provides statistics on a range of socioeconomic aspects relating to urban life in more than 900 cities, each with a population of at least 50 000 inhabitants in the urban centre, spread across the EU Member States, Norway, Switzerland and Turkey; note that there may be considerable differences in relation to the latest reference period available for each city.
Indicator definitions
Population statistics for cities refer to the population at its usual residence, in other words, the place where a person normally lives, regardless of temporary absences; this is generally their place of legal or registered residence. Population numbers are a reference for measuring the general size of an urban entity and are used as a denominator for many derived indicators.
A foreigner is a person who does not have the citizenship of the country of usual residence, regardless of their place of birth. EU foreigners are persons living in the reporting Member State who have the nationality of another EU Member State. Non-EU foreigners are persons living in the reporting Member State with the nationality of a non-member country.
Native-born means a person who was born in the Member State of usual residence regardless of that person’s citizenship. Foreign-born means a person who was born outside of the Member State of usual residence regardless of that person’s citizenship.
The household-dwelling concept is the preferred household unit. It considers all persons living in a housing unit to be members of the same household, such that there is one household per occupied housing unit.
Context
Challenges to European cities
The manner in which cities across the EU are governed and their autonomy varies considerably across EU Member States, according to a combination of administrative layers, at a national, regional, metropolitan / urban, city or borough level.
Cities in the EU face a variety of challenges: ranging from ageing populations, through migration and the consequences of urban sprawl, to counteracting climate change. By contrast, cities attract investment, people and services, thereby stimulating creativity and innovation. There is often a paradox insofar as some of the most thriving cities in the EU have some of the highest levels of social exclusion and income disparities and while cities generally offer the widest range of employment opportunities, some of them have the highest levels of unemployment.
EU urban development policy
The European Commission has stated that ‘it is crucial that all levels of governance be aware of the need to implement effectively the Europe 2020 strategy’.
Urban development policy seeks to promote the economic, social and environmental transformations of cities through integrated and sustainable solutions. It can play a valuable role in the implementation of the Europe 2020 strategy, through a range of sectoral initiatives. Furthermore, urban development issues have been integrated, to a large extent, into regional and national programmes supported by structural and cohesion funds, principally the European Regional Development Fund (ERDF) and the European Social Fund (ESF). For example, during the period 2014–20, each EU Member State should invest at least 5 % of the ERDF in sustainable urban development (to be decided by national urban authorities), while at least 20 % of the ESF budget is available for actions targeting social exclusion, poverty and discrimination, especially among vulnerable groups in society (for example, low-skilled workers, ethnic minorities, the elderly, lone parents or migrants).
Nevertheless, a number of commentators and stakeholders have argued that cities need to be more involved in the conception and implementation of EU policies. Indeed, despite their economic weight, there is no explicit urban dimension to the Europe 2020 strategy or its targets, although three flagship projects — the digital agenda, the innovation union and youth on the move — address urban challenges. As a result, there have been calls for an EU urban agenda to bring together the increasing number of sectoral policies that impact on the EU’s urban areas: for example, within the domains of energy, the information society, climate action, the environment, transport, education or culture.
Towards an EU urban agenda
In February 2014, the European Commission organised a CITIES forum, to discuss how to strengthen the urban dimension of EU policymaking; it was centred on a debate over the need for an EU urban agenda. Many stakeholders saw an opportunity to implement a framework to guide action, to bring coherence to a diversity of initiatives and policies, and to give clear roles for European, national, regional and local authorities. Europe 2020 was seen by many participants as a starting point for priority setting, although some argued that there was a need to go further both in scope and time, given that city development involves long-term processes and long-lasting infrastructure investments.
This was followed, in July 2014, by a European Commission Communication titled, ‘The urban dimension of EU policies — key features of an EU urban agenda’ (COM(2014) 490). It discussed a range of options for developing an urban agenda, including:
- a role for the EU institutions as a facilitator of urban development;
- further integration of sectoral policies so that these are better adapted to urban realities;
- an instrument to involve cities and their political leaders in EU policymaking and policy implementation;
- a tool to integrate the goals of the Europe 2020 strategy with cities’ own strategies.
The communication was also used to launch a public consultation on the urban agenda, the results of which were presented at a second CITIES forum held in June 2015.
See also
- European cities - spatial dimension (background article)
- Territorial typologies for European cities and metropolitan regions (background article)
- Urban-rural typology (background article)
- Urban-rural typology update (background article)
Further Eurostat information
Data visualisation
Publications
- Eurostat regional yearbook 2014 — Chapter 14
- Eurostat regional yearbook 2013 — Chapters 12 and 13
- Eurostat regional yearbook 2012 — Chapter 12
- Eurostat regional yearbook 2011 — Chapter 6
- Eurostat regional yearbook 2010 — Chapter 2
- Quality of life in cities — Perception survey in 79 European cities — European Commission, Flash Eurobarometer 366, October 2013 (PDF file)
- Sustainable development in the European Union
Database
- Urban audit (urb), see:
- Cities and greater cities (urb_cgc)
- Functional urban areas (urb_luz)
- Perception survey results (urb_percep)
Dedicated section
Methodology / Metadata
- Urban Audit (ESMS metadata file — urb_esms)
Source data for figures and maps (MS Excel)
External links