Archive:European Neighbourhood Policy - East - tourism statistics
- Data extracted in September 2015. Most recent data: Further Eurostat information, Main tables and Database. Planned article update: October 2016.
This article is part of an online publication and presents information relating to tourism in the European Union (EU) and the six countries that together form the European Neighbourhood Policy-East (ENP-E) region, namely, Armenia, Azerbaijan, Belarus, Georgia (excluding the regions of Abkhazia and Tskhinvali region/South Ossetia over which the Government of Georgia does not exercise effective control), Moldova (excluding those areas over which the Government of the Republic of Moldova does not exercise effective control) and Ukraine (it should be noted that the geographical coverage of the latest data for Ukraine is often limited to the territories that are under the effective control of the Ukrainian government and this impacts on the comparability of the time series).
This article highlights recent developments concerning the number of bed places, the number of arrivals of non-residents at collective tourist accommodation establishments and the number of outbound trips made by tourists.

(thousands)
Source: Eurostat (enpr_intour) and (tour_cap_nat)

(2004 = 100)
Source: Eurostat (enpr_intour)

(number of bed places per km² of total area)
Source: Eurostat (enpr_intour), (enpr_agmain), (tour_cap_nat) and (demo_r_d3area)

(number of bed places per 1 000 inhabitants)
Source: Eurostat (enpr_intour), (enpr_psdemo), (tour_cap_nat) and (demo_pjan)

(thousands)
Source: Eurostat (enpr_intour) and (tour_occ_arnat)

(2004 = 100)
Source: Eurostat (enpr_intour)

(arrivals of non-residents per 1 000 inhabitants)
Source: Eurostat (enpr_intour), (enpr_psdemo), (tour_occ_arnat) and (demo_pjan)

(thousands)
Source: Eurostat (enpr_intour) and (tour_dem_tttot)

(2004 = 100)
Source: Eurostat (enpr_intour) and (tour_dem_tttot)

(average number of trips per 1 000 inhabitants)
Source: Eurostat (enpr_intour), (enpr_psdemo), (tour_dem_tttot) and (demo_pjan)
Main statistical findings
There were 530 thousand bed places in hotels and similar establishments across the ENP-East countries, the vast majority of which were in Ukraine
The number of bed places available in hotels and similar establishments provides one measure of a country’s capacity to attract tourists; note that official tourism statistics include business travellers as tourists alongside individuals travelling for pleasure or other reasons. The six ENP-East countries had a combined total of 530 thousand bed places (the latest information for each country relates to 2013 or 2014). By comparison, there were 13.6 million bed places in hotels and similar establishments in the EU-28 in 2013.
Among the ENP-East countries, Ukraine had by far the highest number of bed places in hotels and similar establishments, just over 400 thousand in 2014, which equated to 77 % of the total number of bed places available within the six ENP-East countries. Note that the large fall between 2013 and 2014 in the number of bed places in Ukraine shown in Table 1 reflects to a large extent the change in geographical coverage Ukrainian data, in particular the exclusion of the Autonomous Republic of Crimea and the City of Sevastopol.
In Azerbaijan, Belarus and Georgia (latest data are for 2013) there were between 32 and 36 thousand bed places, while there were 14 thousand bed places in Armenia and 6 thousand in Moldova (see Table 1).
The number of bed places grew in five of the six ENP-East countries during the last decade
Figure 1 provides information on the development of the number of bed places in hotels and similar establishments over the period 2004–14. There was almost no change in the number of bed places in the ENP-East country with the highest number of bed places — Ukraine — until 2014 when the number dropped sharply due to the break in series caused by the change in geographical coverage. The remaining five ENP-East countries reported a marked expansion in their bed capacity; there was also an increase in the number of bed places in the EU-28 during the period 2004–13.
Among the ENP-East countries, the fastest expansion in bed places was recorded in Armenia, where this figure more than trebled between 2004 and 2014, despite a relatively large fall in 2014. The number of bed places increased by 50 % or more in Azerbaijan, Georgia (2004–13) and Belarus; note that the increases in the latter two countries occurred almost exclusively in the second half of the time series shown in Figure 1, in other words from 2009 onwards.
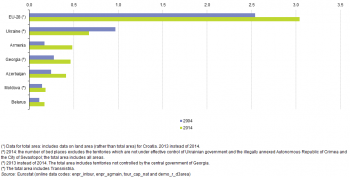
Figure 2 presents an alternative measure for analysing the number of bed places in hotels and similar establishments, presenting this information in relation to the total area of each country. It shows that there was a higher density of bed places per square kilometre (km²) in the EU-28 than in any of the six ENP-East countries. Indeed, with an average of 3.0 bed places per km² in 2014, the EU-28 had a ratio that was approximately four and a half times as high as that in Ukraine, which posted the highest density among the ENP-East countries (0.7 bed places per km² in 2014; note that the number of bed places has a narrower geographical coverage than the area and as such this value for Ukraine is an underestimate).
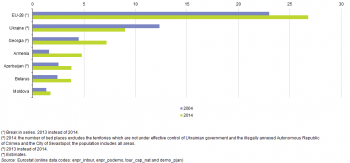
A final analysis of the number of bed places is presented in Figure 3: it compares the number of bed places in hotels and similar establishments to the number of inhabitants in each country. Using this measure, the EU-28 again recorded a higher capacity of bed places than any of the ENP-East countries. There were, on average, 26.8 bed places in hotels and similar establishments per 1 000 inhabitants across the EU-28 in 2013. This was nearly treble the ratio recorded in Ukraine (9.0 bed places per 1 000 inhabitants in 2014; note that the number of bed places has a narrower geographical coverage than the population and as such this value for Ukraine is an underestimate), 3.7 times as high as in Georgia (2013 data), 6–8 times as high as in Armenia, Azerbaijan and Belarus, and 15.4 times as high as in Moldova. Among the ENP-East countries, the fastest expansion in the number of bed places per 1 000 inhabitants between 2004 and 2014 was recorded in Armenia, where this ratio rose from 1.6 to 4.8 bed places.
Approximately 3.8 million non-residents arrived in collective tourist accommodation establishments in the ENP-East countries
There were approximately 3.8 million annual arrivals of non-residents in collective tourist accommodation establishments across the six ENP-East countries (the latest data relates to either 2013 or 2014). This figure could be compared with a total of 313 million arrivals of non-residents at collective tourist accommodation establishments in the EU-28 in 2013 (see Table 2).
Non-resident arrivals in the six ENP-East countries were equivalent to 1.2 % of the EU-28 total. Indeed, the EU is a major tourist destination: according to the United Nations World Tourism Organisation, five EU Member States (France, Spain, Italy, Germany and the United Kingdom) were among the world’s top 10 destinations in 2014 — both in terms of tourist arrivals and international tourism receipts.
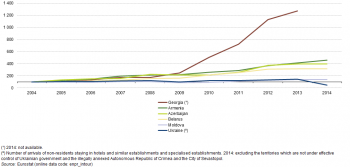
Figure 4 shows the development of the number of arrivals of non-residents staying in collective tourist accommodation establishments during the period 2004–14. There was an increase in the number of arrivals of non-residents in the six ENP-East countries, except for Ukraine where the number fell in 2014, in part at least due to changes in the geographical coverage of the data. The fastest expansion in the number of arrivals of non-residents was recorded in Georgia, where there was a 13-fold increase between 2004 and 2013. Although much slower, the pace of growth was nevertheless considerable in Armenia, Azerbaijan and Belarus, as the number of non-resident arrivals trebled or quadrupled between 2004 and 2014.
Figure 5 shows the number of arrivals of non-residents at collective tourist accommodation establishments relative to the number of (resident) inhabitants. In the EU-28 there were 618 arrivals of non-residents per 1 000 inhabitants in 2013. Among the ENP-East countries, the ratio of non-resident arrivals to population was consistently lower than in the EU-28. The highest value was recorded for Armenia, with 399 non-resident arrivals per 1 000 inhabitants in 2014, while there were less than 100 non-resident arrivals per 1 000 inhabitants in Belarus, Azerbaijan, Moldova and Ukraine. However, the number of non-resident arrivals relative to population increased at a relatively fast pace in several of the ENP-East countries. The largest gains were recorded in Georgia, as this ratio increased 12-fold between 2004 and 2013.
The number of outbound trips taken by tourists reached 22.4 million in Ukraine in 2014
This final section details the outward flow of tourists travelling abroad. EU-28 tourists made 291 million non-domestic trips in 2013; note that EU-28 data for this particular indicator only refer to persons aged 15 and over.
By contrast, among the four ENP-East countries for which data are available (no information for Georgia or Moldova) the highest number of outbound trips taken by tourists was recorded for Ukraine — the most populous of the ENP-East countries — at 22.4 million in 2014. There were 3.3 million outbound trips made by tourists from Azerbaijan in the same year, while the number of outbound trips made from Armenia was 1.2 million and from Belarus it was 0.7 million (see Table 3).
Developments for the number of outbound tourist trips between 2004 and 2014 are shown in Figure 6. There was a rapid expansion in the number of outbound tourist trips from Armenia and Azerbaijan. For Ukraine, there was a more modest increase in the number of outbound tourist trips between 2009 and 2013, before this development was reversed with a fall in 2014. By contrast, the number of outbound trips made by tourists from Belarus fell between 2004 and 2011, before recovering somewhat in 2012, 2013 and 2014.
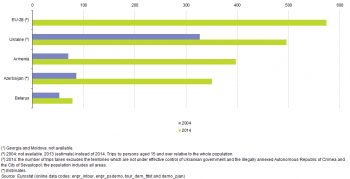
Figure 7 presents the number of outbound trips taken by tourists relative to the national population. In the EU-28 there were, on average, 574 trips per 1 000 inhabitants in 2013; note that the tourist trip figures relate to persons aged 15 and over.
Ukraine recorded the highest number of outbound trips per 1 000 inhabitants among the ENP-East countries, at 496 trips per 1 000 inhabitants in 2014. This was considerably higher than the number of trips made from Armenia (397 per 1 000 inhabitants) ) or Azerbaijan (350), while the ratio of the number of trips made by outbound tourists relative to the national population was even lower in Belarus (78).
Data sources and availability
The data for ENP-East countries are supplied by and under the responsibility of the national statistical authorities of each country on a voluntary basis. The data result from an annual data collection cycle that has been established by Eurostat. These statistics are available free-of-charge on Eurostat’s website, together with a range of additional indicators for ENP-East countries covering most socio-economic topics.
Tourism, in a statistical context, refers to the activity of visitors taking a trip to a destination outside their usual environment, for less than a year. It can be for any main purpose, including business, leisure or other personal reasons other than to be employed in the place visited. A tourist is a visitor that stays overnight (at least one night).
Within the EU, a system of tourism statistics was established through Council Directive 95/57/EC of 23 November 1995 on the collection of statistical information in the field of tourism. This legal basis requires EU Member States to provide a regular set of comparable tourism statistics. Following amendments in 2004 and 2006, the European Parliament and the Council of the European Union adopted Regulation 692/2011 concerning European statistics on tourism in 2011 (repealing Council Directive 95/57/EC).
Tourism statistics in the EU consist of two main components: on the one hand, statistics relating to capacity and occupancy (supply side tourism statistics); on the other, statistics relating to tourism demand. In most EU Member States, the former are collected via surveys filled in by accommodation establishments, while the latter are mainly collected via traveller surveys at border crossings or through household surveys. Statistics on tourism demand refer to tourist participation, in other words, trips of at least one overnight stay during the reference period.
Tables in this article use the following notation:
| Value in italics | data value is forecasted, provisional or estimated and is therefore likely to change; |
| : | not available, confidential or unreliable value. |
| – | not applicable. |
Context
Tourism has the potential to contribute towards employment and economic growth, as well as to development in rural, peripheral or less-developed areas. Infrastructure created for tourism purposes contributes to local development, while jobs that are created or maintained can help counteract industrial or rural decline. Sustainable tourism involves the preservation and enhancement of cultural and natural heritage, ranging from the arts to local gastronomy or the preservation of biodiversity.
In cooperation with its ENP partners, Eurostat has the responsibility ‘to promote and implement the use of European and internationally recognised standards and methodology for the production of statistics necessary for developing and monitoring policy achievements in all policy areas’. Eurostat undertakes the task of coordinating EU efforts to increase the statistical capacity of the ENP countries. Additional information on the policy context of the ENP is provided here.
See also
- All articles on non-EU countries
- European Neighbourhood Policy countries — statistical overview — online publication
- Statistical cooperation — online publication
Further Eurostat information
Publications
- Basic figures on the European Neighbourhood Policy — East countries — 2014 edition
- European Neighbourhood Policy — East countries — Key economic statistics — 2014 edition
- European Neighbourhood Policy — East countries — Labour market statistics — 2014 edition
- European Neighbourhood Policy — East countries — Youth statistics — 2014 edition
Database
- Industry, trade and services (enpr_in)
- ENP countries: tourism (enpr_intour)
- Tourism data (tour), see:
- Monthly data on tourism industries (tour_indm)
- Annual data on tourism industries (tour_inda)
- Annual data on trips of EU residents (tour_dem)
Dedicated section
Methodology / Metadata
- Eastern European Neighbourhood Policy countries (ENP-East) (ESMS metadata file — enpr_esms)
- Capacity and occupancy of tourist accomodation establishments (ESMS metadata file — tour_occ_esms)
- Annual data on trips of EU residents (ESMS metadata file — tour_dem_esms)
- Methodological manual for tourism statistics — version 3.1 — 2014 edition