Archive:People in the EU - statistics on geographic mobility
- Data extracted in June 2015. Most recent data: Further Eurostat information, Main tables and Database.
This article is part of a set of statistical articles that are based on Eurostat’s flagship publication People in the EU: who are we and how do we live? (which also exists as a PDF publication); it presents a range of statistics covering movements in and around the European Union (EU), and focuses principally on people who recently moved home.
(%)
Source: Eurostat (ilc_hcmp05)

(% of population)
Source: Eurostat (ilc_hcmp05)
(% of population aged 18 and over)
Source: Eurostat (ilc_lvps16)

(% of those who moved in the last 12 months)
Source: Eurostat (ilc_lvps16) and (Census hub HC39)

(% of the total number of persons who moved)
Source: Eurostat (ilc_lvps16) and (Census hub HC17)

(% of persons aged 15 years and over who were in employment and moved)
Source: Eurostat (ilc_lvps16) and (Census hub HC12)
(% of men / women aged 15 years and over who were in employment)
Source: Eurostat (ilc_lvps16) and (Census hub HC17)
(% of persons aged 15 years and over who were in employment)
Source: Eurostat (ilc_lvps16) and (Census hub HC17)

(%)
Source: Eurostat (ilc_lvps16) and (Census hub HC39 and HC45)
(% of the total number of persons who moved)
Source: Eurostat (ilc_lvps16) and (Census hub HC39 and HC45)
(% of population)
Source: Eurostat (ilc_lvps16) and (Census hub HC46)
(number of residents)
Source: Eurostat (ilc_lvps16) and (Census hub HC39)
(number of residents)
Source: Eurostat (ilc_lvps16) and (Census hub HC39)

(% of persons aged 15 years and over)
Source: Eurostat (tour_dem_toage) and (demo_pjanbroad)
Main statistical findings
The EU’s population is increasingly mobile: while most people only move around the EU on a temporary basis for holidays (see the end of this article for more details) or business trips, a small but growing proportion of Europeans relocate to other EU Member States on a (semi-) permanent basis.
The free movement of persons constitutes one of the fundamental freedoms of the internal market, and is enshrined in law (Article 45 of the Treaty on the Functioning of the European Union and subsequent secondary legislation). As such, citizens of EU Member States, together with their immediate family — spouses / registered partners, children, and dependent parents or grandparents — are entitled to:
- look for a job in another EU Member State;
- work in another EU Member State without a work permit;
- live in another EU Member State while working or once they have retired.
An article on Home comforts — housing conditions and housing characteristics highlights that many people spend a considerable proportion of their time at home, and give considerable weight to their living conditions when determining overall measures in relation to their quality of life.
Moving home
Residential mobility — movements from one place of residence to another — may be viewed in the context of each individual’s journey through life, whereby there are a number of steps that often result in people moving home. One of the biggest decisions is usually that of leaving the parental home: thereafter, other major life events such as deciding to live with someone else or having children also impact on people’s choices over where they live and the type of dwelling they would like to live in. A range of additional factors also impact on residential mobility, such as the location of higher education establishments, career opportunities, retirement options, or the availability and price of dwellings for rent or purchase.
A quite recent development is the increase in migration of students and of retired people. Retirement migration is an increasing form of mobility at the later stages of the life course of Europeans. In recent years, retirement destinations have become more diverse and extend beyond the local, regional and even national level to increasingly involve international localities, particularly in southern Europe.
Populations on the move by tenure status
Residential mobility peaked in the Nordic Member States and the United Kingdom
According to an ad-hoc module that formed part of the EU statistics on income and living conditions (EU-SILC) survey in 2012, some 17.6 % of the EU-28’s population moved home during the five-year period up to 2012. The highest mobility rates were recorded in the Nordic Member States: some 40.2 % of the Swedish population moved during this period, while around one third of the population in Denmark (34.3 %) and Finland (31.9 %) moved home; the United Kingdom (30.8 %) was the only other Member State to record a share above 30 %. At the other end of the range, people tended to be less mobile in the southern and eastern EU Member States, for example, fewer than 5 % of the population moved in Croatia, Bulgaria and Romania during the five-year period up to 2012.
By tenure status, tenants renting at market prices had the highest degree of mobility
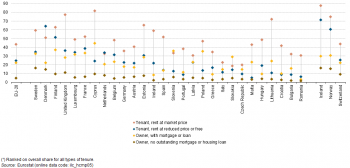
Figure 1 shows an analysis of the proportion of people moving home during the five-year period up to 2012 by tenure status; this data comes from EU-SILC. Private tenants (people who rent their accommodation at market prices) were more likely to move home than homeowners: across the EU-28, some 43.2 % of private tenants moved during the five-year period up to 2012, this share was almost twice as high as that recorded among homeowners with a mortgage (22.0 %).
There were 10 EU Member States where more than half of the population in private rental accommodation moved during the five-year period up to 2012. These high degrees of mobility peaked in Cyprus (81.6 %), the United Kingdom (77.1 %) and Lithuania (72.1 %) which may reflect, at least to some degree, relatively relaxed regulatory environments for renting or flexible labour markets. By contrast, lower degrees of residential mobility may be recorded in those rental markets characterised by more complex regulatory environments, as controls on rental prices or the length of contracts may ‘lock-in’ existing tenants. The lowest shares of residential mobility among those renting at market prices were recorded in Italy, the Czech Republic and Slovakia, with around one fifth of this group moving during the five-year period up to 2012.
Home ownership and social housing tended to result in lower levels of mobility …
In the EU-28, more than one fifth (22.0 %) of all homeowners with a mortgage or housing loan had moved home during the five-year period up to 2012. This lower level of residential mobility among homeowners — compared with those living in private rental accommodation — may, at least in part, be explained by the higher transaction costs that are generally associated with buying or selling a property. These charges, which may act as a barrier to mobility, include registration costs, sales taxes, legal and notary fees, as well as estate agent fees. There were 10 EU Member States where more than one quarter of all homeowners with a mortgage had moved during the five-year period up to 2012; this share rose to 35–37 % in Poland, Slovenia and Finland, and peaked at 44.3 % in Cyprus.
By contrast, only 4.7 % of EU-28 homeowners with no outstanding mortgage or housing loan moved during the five-year period up to 2012. These figures also suggests that residential mobility may be lower in those EU Member States that are characterised by high levels of home ownership, while those economies with a more established rental market may be characterised by higher degrees of mobility. There were only three EU Member States where more than 1 in 10 homeowners without a mortgage or housing loan had moved during the five-year period up to 2012: Sweden (16.2 %), Denmark (14.5 %) and the United Kingdom (11.1 %).
… although this was not the case for those living in reduced price or free accommodation in Denmark and the Netherlands
Almost one quarter (24.5 %) of EU-28 tenants with reduced or free rent (for example, those living in social housing) moved home during the five-year period up to 2012; this could be contrasted with a 43.2 % share for private tenants in rental accommodation. This gap between the two types of tenants was particularly pronounced in Lithuania and Cyprus, where the proportion of tenants renting at market prices who moved during the five-year period up to 2012 was 61.3 and 57.4 percentage points higher than among those renting at a reduced price or free.
By contrast, the degree of mobility among tenants renting at reduced prices or free was particularly high in Denmark (63.9 %) and Finland (51.2 %), where more than half of those concerned moved during the five-year period up to 2012. Denmark and the Netherlands were the only EU Member States where residential mobility was higher for tenants living in reduced price or free accommodation compared with tenants living in private rented accommodation.
Populations on the move by degree of urbanisation
Europeans living in cities were more likely to move than those living in rural areas
Figure 2 (also derived from the ad-hoc housing module that formed part of EU-SILC) provides an alternative analysis of those persons who moved during the five-year period up to 2012, with information according to the degree of urbanisation. It shows that across the EU-28, there was a higher likelihood that people living in cities (20.9 %) had moved during the five-year period up to 2012 than those living in rural areas (13.4 %). This pattern held in each of the EU Member States: in Austria, Luxembourg, Denmark, Germany and the Netherlands the share of city-dwellers having moved during the previous five years was at least 10 percentage points higher than the share recorded among people living in rural areas.
Home ownership by country of birth
The highest levels of home ownership were recorded for native-born populations
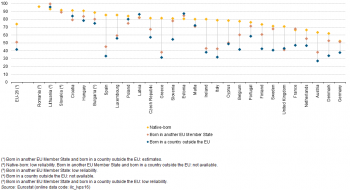
According to EU-SILC, almost three quarters (73.6 %) of the EU’s native-born population (aged 18 and over) was living in an owner-occupied home in 2013. This share was considerably higher than the corresponding shares recorded for residents born in other EU Member States (50.9 % were homeowners) or countries outside of the EU (41.5 % were homeowners).
It is interesting to note that there were considerable differences between the EU Member States in the proportion of native-born populations who were homeowners. In excess of 90 % of the native-born population in Romania, Lithuania, Slovakia, Croatia and Hungary lived in an owner-occupied home, a share that fell to between 62 % and 66 % in Denmark, Austria, the Netherlands and France, with Germany recording a much lower share of native-born persons living in owner-occupied homes (51.9 %). There is a thriving rental sector in Germany, which may be promoted by increased security of tenure for private tenants (for example, an unlimited duration for contracts).
This pattern of higher home ownership for native-born residents was repeated in most of the EU Member States and was particularly pronounced in Spain, Greece, Italy and Ireland. By contrast, the proportion of homeowners in France was slightly higher among those born in another EU Member State (67.4 %) than it was for native-born residents (66.4 %) and in Germany there was also little difference (51.2 % of those born in another EU Member State lived in an owner-occupied home, compared with 51.9 % among native-born residents). There was a different pattern in the Baltic Member States, where home ownership tended to be higher among foreign-born residents, whether from another EU Member State or from a country outside of the EU.
European residents on the move
Almost 32 million persons moved home in the EU during the year prior to the census
Having established some general patterns of mobility and home ownership across the EU Member States, this next section looks in more detail at those who moved home during the 12-month prior to the population and housing census conducted in 2011. There were almost 32 million persons in the EU (excluding Bulgaria, for which data are not provided) who changed their usual residence during this period: of these, over 7 million persons moved in each of France and the United Kingdom (22.7 % and 23.4 % of the EU total).
Did you know?
The highest numbers of residents who changed their dwelling during the 12-month period prior to the population and housing census being conducted were recorded in Inner London - East (384 thousand), Grande Lisboa (287 thousand) and Paris (279 thousand) — these were the highest in absolute values in 2011 across any of the NUTS level 3 regions in the EU.
For more information: refer to the CENSUS HUB
Figure 4 shows the distribution of EU residents who moved, according to the size of the locality to which they moved. At opposite ends of the spectrum, there were roughly equal shares for those who moved into localities with at least one million inhabitants (16.4 % of the total number of persons who moved during the year prior to the census) and those who moved into localities with fewer than 2 thousand inhabitants (17.1 %).
Socioeconomic characteristics of residents who moved in the 12-month period prior to the census
Having examined the flows of people moving into and around the EU-28, this next section turns to look at some of the socioeconomic characteristics of those residents who moved during the 12-month period prior to the population and housing census (irrespective of where they came from).
Those in the labour market had a higher propensity to move home …
Figure 5 shows that approximately half (50.2 %) of the total population of the EU-28 who moved during the 12-month period prior to the census were in employment, while 42.5 % were economically inactive (including those in education or in retirement) and 7.3 % were unemployed. These figures can be compared with totals for the whole of the EU-28 population in 2011, when 43.6 % of the population were employed, 4.7 % were unemployed, and 51.8 % were inactive. As such, those in employment and unemployment had a higher propensity to move home than the inactive population.
Those in the labour force (the employed and unemployed) accounted for more than 60 % of the people who moved in Germany and Luxembourg (where one of the main drivers for changing residence appeared to be new job opportunities); this was also the case in Cyprus, Ireland and Spain, three of the economies that were most affected by the financial and economic crisis, where unemployed persons may have been relocating in search of a new job or because they could no longer afford to pay for their home, be it a rental property or owner-occupied with a mortgage. For example, almost one quarter (23.6 %) of the people who moved in Spain during the 12-month period prior to the census were unemployed.
… while the likelihood of moving was higher among younger persons
An analysis by employment status and by age — as shown in Figure 6 — provides evidence that the likelihood of someone moving home decreases as a function of their age; this information is also derived from the population and housing census. People aged 15–29 years accounted for 44.4 % of the total number of employed persons who moved home in the EU-28 during the 12-month period prior to the census. Economic theories of mobility are largely based on the assumption that people try to maximise their net gains (their increased earnings potential minus the costs of moving); therefore, younger persons tend to have a greater incentive to move, as their total possible earnings are greater, given they have a longer working life ahead. Such differences may also reflect, in part, the relatively precarious nature of employment for many in this age group, but may also reflect a number of different changes in personal situations — such as leaving the parental home, deciding to live with someone else, or choosing to start a family. More detailed information in relation to these aspects is provided in an article on Changing family life — portrait of household and family structures.
People in occupations and economic activities associated with higher degrees of educational attainment had a higher propensity to be more mobile
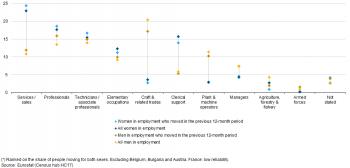
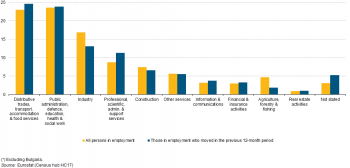
The information presented in Figures 7 and 8 — also from the population and housing census — provides an analysis of the proportion of residents who moved home during the 12-month period prior to the census, by occupation and by economic activity (as defined by NACE); in both cases the information for people moving home is compared with that for all persons in employment.
Figure 7 shows that the likelihood of someone moving home was higher for a range of occupations associated with higher levels of educational attainment, for example, professionals and technicians / associate professionals were more likely to move, whereas the propensity to move was lower than among those with craft and related trades, agriculture, forestry and fishery, or clerical support occupations.
Figure 8 presents a similar analysis by economic activity and confirms the results observed in Figure 7 insofar as those working in traditional activities such as industry, agriculture, forestry and fishing or construction moved less often than their overall share in total employment, while those employed in professional, scientific, administrative and support services, distributive trades, transport, accommodation and food services, or information and communication services were more likely to move. Note that many services are omnipresent, while specific industrial or agricultural activities may only be located in a few regions.
There is some evidence to support the view that those with more developed skills and competencies have a higher propensity to consider employment opportunities over a wider geographical area: changing region or country may be more part of the professional culture of certain highly-educated workforces in areas such as professional and scientific services or information and communication services.
Foreign-born residents were more than twice as likely to move as native-born residents
Within the EU (again excluding Bulgaria), foreign-born residents were generally more mobile than native-born residents. In 2011, the proportion of foreign-born residents who moved during the 12-month period prior to the population and housing census was 12.3 %, which was more than twice as high as the share recorded for the native-born population (5.8 %). These differences may be linked to geographic and labour market mobility of foreign-born residents, and a range of different factors, including: a higher proportion of foreign-born residents live in rental accommodation; migrants tend to be relatively young and willing to occupy temporary, low-skilled or part-time jobs — often below their educational qualifications or skills — in order to enter or move within the labour market; migrants may engage in circular migration, whereby they move between different EU Member States or between their home country and other EU Member States (for example, in order to obtain seasonal work).
In 2011, this pattern of foreign-born residents being more likely to move home during the 12-month period prior to the population and housing census was repeated in all but three of the EU Member States. The three Baltic Member States were the only exceptions to this rule, with the native-born population more likely to have moved than the foreign-born population. In Malta and Spain, foreign-born residents were around five times as likely to move as the native-born population, while this ratio rose to around 6:1 in Cyprus, and peaked at 7.5:1 in Romania. The largest differences (in percentage point terms) between the shares of foreign-born and native-born residents who moved home during the 12-month period prior to the population and housing census in 2011 were recorded in Slovakia (where the share for foreign-born residents was 29.2 points higher), Cyprus (17.4 points) and Finland (15.0 points).
Across the EU (excluding Bulgaria), there was almost no difference in the residential mobility of foreign-born residents between those born in another EU Member State (12.2 % moved during the 12-month period prior to the population and housing census) and those born in a country outside the EU (12.3 % had moved). The individual EU Member States were almost equally divided, insofar as 14 reported a higher proportion of residential mobility among those born in a country outside the EU, while mobility was higher in 13 others for those born in another EU Member State.
Foreign-born residents accounted for almost one in five persons who changed residence
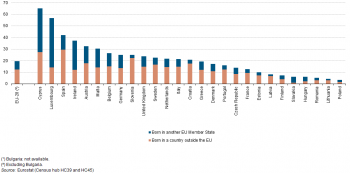
Figure 10 is also based on information from the population and housing census and analyses the relative share of foreign-born residents in the total number of persons who moved home during the 12-month period prior to the census; these figures reflect, at least to some degree, the stock of foreign-born residents already in the EU as a result of different historical waves of migration, as well as more recent migrant flows during the year prior to the census.
In 2011, residents born in a country outside the EU accounted for 12.3 % of the total number of persons who moved home during the 12-month period prior to the census; the corresponding share for residents born in another EU Member State was 7.2 %. As such, all foreign-born residents together accounted for almost one in five persons who moved in the EU during the 12-month period prior to the census.
Foreign-born residents accounted for more than half of the total number of residents who moved in Cyprus (65.0 %) and Luxembourg (56.8 %); in both cases the majority of the foreign-born residents moving were born in another EU Member State. Ireland, Slovakia, Malta and Hungary were the only other EU Member States where residents born in another EU Member State accounted for a higher proportion of the total number of persons who moved home than residents born in a country outside the EU.
By contrast, almost one third (29.5 %) of the total number of residents who moved home in Spain during the 12-month period prior to the census were born in a country outside of the EU (a majority of these were from the Caribbean, Central or South America), while more than one fifth (22.3 %) of the total number of residents in Slovenia who moved home were born outside the EU (the vast majority from countries in Europe that are not EU members).
More detailed residential mobility statistics
Although the focus of analysis so far has been on national and international mobility patterns, information from the population and housing census may be used to show that the vast majority of people who moved in the EU during the 12-month period prior to the census did so within a very restricted geographical area.
Did you know?
In 2011, there were 60 845 persons who moved from abroad into Inner London - East during the 12-month period prior to the population and housing census being conducted — the highest number across NUTS level 3 regions in the EU.
People moving from abroad into Inner London - West during the 12-month period prior to the census accounted for 4.6 % of the resident population in 2011; the highest proportion across NUTS level 3 regions in the EU.
For more information: refer to the CENSUS HUB
Indeed, residential and labour market mobility is generally quite low in the EU, especially in light of the often considerable labour market imbalances between EU Member States: for example, in 2011, unemployment rates ranged from a high of 21.4 % in Spain to a low of 4.6 % in Austria, while annual net earnings for a two-earner married couple with two children (where both parents earned the average wage) ranged from a high of EUR 116 230 in Belgium to a low of EUR 10 230 in Bulgaria. This apparent lack of mobility may be explained, to some degree, by: a lack of language skills that prevent people moving to another country; difficulties in comparing educational and professional qualifications; a lack of access to credit (especially in the aftermath of the financial and economic crisis); a variety of cultural and institutional barriers; or the social costs of leaving one’s family, friends, colleagues and local community behind. These links between housing, mobility and the labour market are explored further in this section.
While interpreting the analysis that follows it is important to note there are considerable differences in the land area of each EU Member State: for example, a change of residence from Bremen in the north of Germany to München in the south equates to a move of almost 800 km, while the distance between the Austrian capital of Vienna and the Slovak capital of Bratislava is approximately one tenth of this as is the distance between the Finnish capital of Helsinki and the Estonian capital of Tallinn.
The vast majority of Europeans either did not move or chose to move within the same region
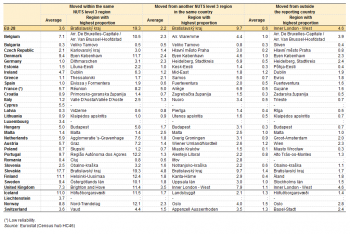
Table 1 shows that 6.4 % of EU-28 population (32.0 million residents) moved home during the year prior to the census: 3.6 % (or 18.1 million residents) from within the same NUTS level 3 region; 2.2 % (11.0 million residents) from another region of the same country; and 0.6 % (2.9 million residents) from abroad.
As noted above, the highest numbers of people moving home were recorded in France and the United Kingdom. Within the latter, there was a relatively high propensity for residents to move within the same NUTS level 3 region (7.3 % of the population of the United Kingdom, approximately double the EU average), although higher shares were recorded in Denmark and Sweden (both 9.4 %), Portugal (9.7 %), Finland (11.1 %) and Slovakia (17.7 %). In France, while the share of the population who moved within the same NUTS level 3 region (5.7 %) was higher than the EU average, almost the same proportion of residents (5.0 %) moved between different NUTS level 3 regions; this was the highest share of residents moving between different NUTS level 3 regions recorded among any of the EU Member States.
The 2.9 million residents who moved from outside the reporting country (note these persons could be foreign-born or returning national-born persons) accounted for 0.6 % of the EU-28 population in 2011. Their relative share rose to 1.0 % in Belgium, Denmark and Malta, 1.1 % in the United Kingdom, 1.2 % in Ireland and Austria, and peaked at 1.4 % in Slovakia. In absolute terms, there were almost 690 thousand residents in the United Kingdom who moved from abroad during the previous 12 months (23.5 % of the EU-28 total), while the next highest totals were recorded in Germany (almost 400 thousand) and France (almost 315 thousand).
Around 200 thousand residents moved from other EU Member States to each of Germany and the United Kingdom
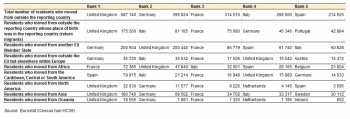
Table 2 focuses on those residents who moved from outside of the reporting country and shows the most popular destinations (at the level of EU Member States) for new residents arriving from abroad during the 12-month period prior to the population and housing census.
The largest flows of residents from other EU Member States were into Germany and the United Kingdom (with just over 200 thousand persons moving to each), reflecting in part the size of these two economies, but also their economic situation in the aftermath of the financial and economic crisis, as well as the relatively high proportion of EU citizens who are able to speak English and to a lesser extent German.
The most popular destinations for residents arriving from other continents were often characterised by historical / colonial, cultural or linguistic ties: for example, the largest number of people moving from Africa set-up home in France, the largest numbers from the Caribbean, Central or South America (combined) located in Spain, and the largest numbers of people moving from North America, Asia and Oceania moved to the United Kingdom.
Capital regions tended to record very high degrees of residential mobility …
Did you know?
In 2011, almost one third (30.7 %) of the residents in the Slovak capital of Bratislavský Kraj moved residence during the 12-month period prior to the population and housing census being conducted — the highest share across any of the NUTS level 3 regions in the EU.
For more information: refer to the CENSUS HUB
Turning attention to regional statistics, almost one third (30.7 %) of the population living in the Slovak capital of Bratislavský kraj changed their residence during the 12-month period prior to the census. There were seven additional Slovak regions where upwards of one in five of the population moved home, and they were joined by two regions from the United Kingdom (Inner London - West and Nottingham).
An additional 17 of the 1 315 regions had between 15 and 20 % of their residents move in the 12-month period prior to the population and housing census: the vast majority of these (15 of the 17) were cities in the United Kingdom, while the other two were the Belgian and Danish capitals of Arr. De Bruxelles-Capitale / Arr. Van Brussel-Hoofdstad and Byen København; there were also two regions in Norway where the share of residents moving home as a share of the total resident population was within the range of 15–20 %, the capital region of Oslo and Nord-Trøndelag.
… and were particularly attractive to those residents arriving from abroad
Almost one fifth (19.3 %) of the population of Bratislavský kraj moved within the same region during the 12-month period prior to the population and housing census, the highest share among any of the 1 315 NUTS level 3 regions for which data are available. Bratislavský kraj also recorded the highest degree of residential mobility among those moving from another region in the same country (9.7 % of the total population). However, the highest share of new residents from abroad was recorded in Inner London - West (4.6 % of the population). A more detailed analysis of the 50.5 thousand new residents who moved from abroad to Inner London - West during the 12-month period prior to the census reveals that more than half (53.3 %) were born outside the EU, while approximately one third (32.8 %) were born in another EU Member State, and 13.8 % were born in the United Kingdom (return migrants).
These patterns observed in the British capital were synonymous with those observed in many of the other EU Member States, insofar as the highest regional shares of residential mobility for those moving from abroad were recorded in the capital regions of Belgium, the Czech Republic, Denmark, Ireland, Latvia, Hungary, Malta, the Netherlands, Austria, Slovakia and Sweden.
London, Paris, Cataluña and Lombardia were the most popular regions in the EU for new residents arriving from abroad
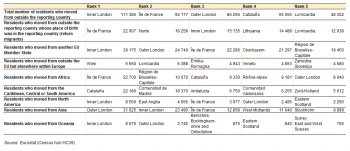
Table 3 provides similar information to that shown in Table 2, but focuses on population and housing census data for NUTS level 2 regions. It shows the five most popular destinations for new residents moving from abroad were all large metropolitan areas, they included: Inner London (111.4 thousand people), the Île de France (94.2 thousand), Outer London (86.3 thousand), Cataluña (55.1 thousand) and Lombardia (48.3 thousand).
The destinations commonly chosen by migrants moving from abroad were often quite concentrated, perhaps reflecting the desire to move close to fellow citizens when arriving in a new country. For example, of the 19.6 thousand new residents who arrived in the United Kingdom from Oceania, almost 60 % moved to Inner or Outer London. In a similar vein, nearly half of the non-EU Europeans who moved to Austria were resident in Wien, while almost half of those who moved to Spain from the Caribbean, Central or South America were resident in either Cataluña or the Comunidad de Madrid, and almost one third of Africans who moved to France were resident in Paris.
It is also interesting to analyse the distribution of return migrants, in other words people born in the reporting country, but moving back from another country. In Lithuania (a single region at this level of detail), this group accounted for 90.0 % of those moving from abroad. This may, at least in part, be explained by relatively high numbers of Lithuanians leaving home in search of work following accession to the EU in 2004, a pattern that was reinforced by a rapid contraction in economic activity in 2008 as a result of the financial and economic crisis, while the subsequent recovery in the Lithuanian economy may have led some migrants to consider returning home.
European tourists on the move
This article closes with an alternative perspective of mobility, namely, tourism opportunities that are open to Europeans for discovering other regions within their own country, neighbouring European countries, or cultures further afield in other continents.
Within the EU, the Schengen area has enhanced the freedom of movement since 1995, allowing people to cross internal borders without being subjected to border controls and checks when travelling between most EU Member States. Today, the Schengen area encompasses all but six of the EU Member States, as well as Iceland, Liechtenstein Norway and Switzerland; Ireland and the United Kingdom have opt-outs, while the membership of Bulgaria, Croatia, Cyprus and Romania is currently under preparation.
Based on Eurostat’s tourism statistics, Figure 11 shows the proportion of EU residents (aged 15 or over) having made at least one trip with an overnight stay for personal reasons; the data is analysed by the tourist’s destination. In 2013, an estimated 60.0 % of the EU-28’s residents enjoyed some form of holiday for personal reasons. Just under half (47.3 %) made a domestic trip (or trips), while 29.5 % of the adult population took a holiday abroad in a foreign destination. Within these groups, 16.7 % of the EU-28 adult population were fortunate to make both domestic trip(s) and to take a holiday(s) abroad.
Data for 2013 are available for most of the EU Member States (no data for Sweden; data for the United Kingdom refer to 2012): in Finland, as many as 88.5 % of the population aged 15 or over had at least one night of holiday, while shares of at least 80 % were also recorded for tourists from Luxembourg, the Netherlands and Denmark. At the other end of the scale, just less than one third of the Greek population had at least one overnight stay in 2013, a share that fell close to one quarter in Romania (25.1 %) and Bulgaria (22.2 %).
Tourists from Luxembourg, Denmark and the Netherlands were most inclined to take foreign holidays in 2013, which may be attributed — at least in part — to their relatively small land area, their location, and the comparative wealth of their citizens. The most extreme example was in Luxembourg, where less than 1 % of the adult population made only a domestic trip (or trips) for their holidays, while almost three quarters (73.4 %) went exclusively on holiday abroad. In neighbouring Belgium only 5.3 % of the adult population went exclusively on holiday in their own country. By contrast, in Romania (1.6 %), Bulgaria (3.2 %), Greece (4.9 %) and Portugal (8.4 %), fewer than 1 in 10 adults went on holiday abroad.
See also
- All articles from People in the EU: who are we and how do we live?
Further Eurostat information
Main tables
Database
- Immigration (migr_immi)
- Emigration (migr_emi)
- Acquisition and loss of citizenship (migr_acqn)
Dedicated section
Source data for tables and figures (MS Excel)
Other information
- EU legislation on the 2011 Population and Housing Censuses - Explanatory Notes
- Legislation relevant for the population and housing census
- Target variables and common guidelines for EU-SILC
- Legislation relevant for income and living conditions statistics
- Demographic statistics: a review of definitions and methods of collection in 44 European countries
- Legislation relevant for population statistics
External links
- Moving and working in Europe
- European Commission — Directorate-General for migration and home affairs — Migration
- European Commission — Directorate-General for migration and home affairs — Family reunification