Archive:Asia-Europe Meeting (ASEM) - a statistical portrait - economy and finance
- Data from July 2014. Most recent data: Further Eurostat information, Main tables and Database.
This article is part of a set of statistical articles based on Eurostat’s publication Asia-Europe Meeting (ASEM) — A statistical portrait.
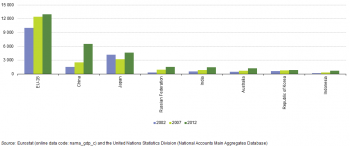
(billion EUR) - Source: Eurostat (nama_gdp_c) and the United Nations Statistics Division (National Accounts Main Aggregates Database)

(%) - Source: Eurostat (nama_gdp_k) and the United Nations Statistics Division (National Accounts Main Aggregates Database)

(USD based on purchasing power parities) - Source: Eurostat (nama_gdp_k) and the World Bank (DataBank)
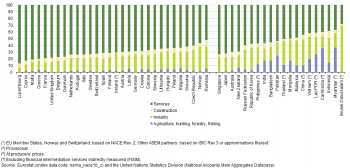
(% of total value added at basic prices) - Source: Eurostat (nama_nace10_c) and the United Nations Statistics Division (National Accounts Main Aggregates Database)
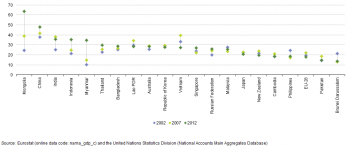
(% of gross domestic product) - Source: Eurostat (nama_gdp_c) and the United Nations Statistics Division (National Accounts Main Aggregates Database)

(% of gross domestic product) - Source: Eurostat (gov_a_main) and the International Monetary Fund (World Economic Outlook Database)

(% of gross domestic product) - Source: Eurostat (gov_dd_edpt1) and the International Monetary Fund (World Economic Outlook Database)
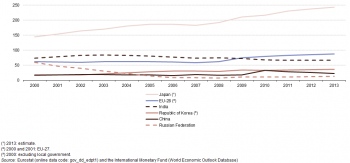
(% of gross domestic product) - Source: Eurostat (gov_dd_edpt1) and the International Monetary Fund (World Economic Outlook Database)


(% of gross domestic product) - Source: Eurostat (bop_fdi_main), the United Nations Conference on Trade and Development (UNCTADstat) and ASEAN statistics (Macroeconomic Indicators)

(% share of extra-EU-27 net inflows of foreign direct investment) - Source: Eurostat (bop_fdi_main)
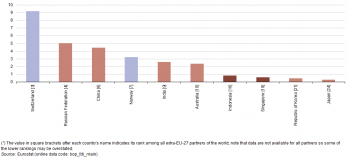
(% share of extra-EU-27 net outflows of foreign direct investment) - Source: Eurostat (bop_fdi_main)
This article focuses on economic and finance data about the European Union (EU), Norway and Switzerland in comparison with 20 Asian ASEM partners. It covers key indicators concerning gross domestic product (GDP), government finances, prices and foreign direct investment.
The use of the term European ASEM partners in this article refers to the 28 Member States of the EU, Norway and Switzerland. The use of the term Asian ASEM partners in this article refers to the 10 members of the Association of Southeast Asian Nations (ASEAN) and the 10 remaining ASEM partners referred to as Northeast and South Asia (NESA).
Main statistical findings
Gross domestic product
In 2012, the total economic output of the world, as measured by GDP, was valued at EUR 56 577 billion, of which the ASEM partners accounted for 57.2 %, 3.2 percentage points more than in 2002. For more information on the shares of selected ASEM partners in world GDP see Figure 5 in the key facts article. In 2012, the European ASEM partners contributed 42.8 % of the GDP generated by all economies within ASEM, while ASEAN members contributed 5.7 % and NESA 51.6 %.
In 2012, the EU-28's GDP was valued at EUR 12 960 billion. China had the largest economy among the Asian ASEM partners, with GDP valued at EUR 6 506 billion, just over half (50.2 %) the size of that of the EU-28 (see Figure 1). China’s GDP overtook that of Japan in 2009 to become the largest Asian economy.
The annual rate of change for GDP in real terms (therefore after removing the impact of price changes) is shown in Figure 2 for the period 2000–12. Among the larger ASEAN economies shown in the top half of the figure, Indonesia recorded uninterrupted growth, whereas the others reported a contraction in activity during the global financial and economic crisis; Singapore’s economy also contracted in 2001. The bottom half of the figure shows some of the largest NESA economies, with uninterrupted growth recorded in China and India, while the Russian Federation and Japan posted contractions during the crisis. The EU-28’s economy also contracted during the global financial and economic crisis and again in 2012.
During the period 2000–12 China’s economy averaged annual growth of 10.1 % and India’s averaged 7.2 % growth, while Indonesia, Singapore, Malaysia, the Russian Federation and Thailand all averaged annual growth between 4 % and 6 %. Japan’s annual average growth was 0.7 %, about half the 1.3 % recorded for the EU-28.
Figure 3 shows an analysis of gross national income (GNI) per capita in purchasing power parities terms; in other words, the GNI data have been divided by the size of the population and adjusted for price level differences. Among the ASEM partners, the highest GNI per capita in 2013 was USD 76 850 recorded in Singapore, although it should be noted that data are not available for Brunei Darussalam which had the highest value in 2008. Norway, Luxembourg (2012 data) and Switzerland (2012 data) also reported high levels of GNI per capita, all above USD 50 000. All of the other European ASEM partners reported GNI per capita above the world average of USD 14 211 as did six of the remaining Asian ASEM partners. In Pakistan, Lao PDR and Cambodia GNI per capita was below USD 5 000, while the lowest value (USD 2 810) was recorded for Bangladesh: this gave a ratio between the average GNI per capita in Singapore and that in Bangladesh of 27:1.
The analysis of the broad structure of value added presented in Figure 4 shows some key differences between the European and Asian ASEM partners in 2012:
- the relative weight of services was larger among European partners (72.9 %) than Asian partners (56.7 %);
- agriculture, hunting, forestry and fishing were much larger among Asian partners (7.4 %) than European partners (1.6 %);
- industry was also larger among Asian partners (29.4 %) than European partners (19.7 %).
Between the ASEAN members and NESA there were also some notable differences. ASEAN members had a higher contribution from agriculture, hunting, forestry and fishing (12.3 %) and industry (33.2 %), while less than half (47.9 %) of their total value added came from services.
Among the individual ASEM partners, the highest contributions from agriculture, hunting, forestry and fishing were in Myanmar and Cambodia where these activities accounted for more than one third of total value added. Brunei Darussalam — which is rich in petroleum and natural gas resources — had by far the highest contribution from industry as these activities provided more than two thirds (68.2 %) of its total value added, far ahead of the next highest industrial share which was 38.5 % in China. Among the Asian ASEM partners the services share peaked at 73.2 % in Singapore. Among the European ASEM partners, 11 EU Member States reported a higher share of activity within services than the level recorded in Singapore, most notably the tourism focused economies of Greece, Malta and Cyprus — where shares above 80 % were recorded — and the financial services focused economy of Luxembourg, which recorded the highest share among all ASEM partners, services accounting for 86.7 % of total value added.
Gross capital formation
Gross capital formation includes investment in fixed capital and valuables as well as changes in stocks; relative to GDP it gives a broad indication of the scale of investment in an economy. For the EU-28, gross capital formation was 18.1 % of GDP in 2012 (see Figure 5), a figure that was higher than that recorded for Brunei Darussalam and Pakistan, but lower than in all other Asian ASEM partners.
Figure 5 shows the 2002, 2007 and 2012 levels of this indicator for the EU-28 and all of the Asian ASEM partners. Mongolia had by some margin the highest ratio of gross capital formation to GDP in 2012. As well as Mongolia, several of the other Asian ASEM partners recorded a large increase in this ratio during the last decade (2002–12), notably Myanmar, Indonesia, India and China; each of these countries recorded an increase of at least 10 percentage points. Note that in India this relatively large increase took place between 2002 and 2007 as the ratio actually fell between 2007 and 2012. By contrast, Brunei Darussalam, the Philippines and Vietnam recorded values for this ratio that were 6–8 percentage points lower than they had been in 2002.
Government finances
The global financial and economic crisis of 2008–09 and subsequent sluggish recovery in much of the EU-28 resulted in a considerable impact on key government finance indicators, notably government borrowing/lending for a particular year (public balance) and the consolidated stock of debt at the end of the year (general government debt).
An excess of government expenditure relative to revenue leads to a deficit and this situation was observed for most ASEM partners in Figure 6 for 2013. In the EU-28, government expenditure was equivalent to 49.0 % of GDP in 2013 while for revenue the equivalent ratio was 45.7 %. Brunei Darussalam was the only Asian ASEM partner with a ratio of government revenue to GDP that was higher than that in the EU-28, while none of the Asian ASEM partners recorded government expenditure relative to GDP within 5 percentage points of the EU-28 average: the highest was 43.8 % in Mongolia.
Norway was the only European ASEM partner with a substantial government surplus in 2013, although Luxembourg, Germany and Estonia had almost balanced positions. Among the Asian ASEM partners the only surpluses were recorded for Brunei Darussalam, Singapore and the Republic of Korea, while the Philippines and Thailand had almost balanced positions. By far the largest deficits among all of the ASEM partners were recorded by Slovenia, Greece and Mongolia, all in excess of 10.0 % of GDP.
As can be seen from Figure 7, most ASEM partners, particularly the European ones, recorded larger deficits in 2009 and 2010 than in 2013 as measures were taken to try to counter the effects of the global financial and economic crisis. A few ASEM partners had notably bigger deficits in 2013, namely Slovenia, Mongolia and Pakistan, while the deficits in Sweden, Indonesia and Bangladesh in 2013 were slightly larger than in 2009 and 2010.
Figure 8 shows the development of general government gross debt for the EU-28 and a selection of larger Asian ASEM partner economies. Government debt for the EU-28 was relatively stable between 2000 and 2008, but it increased notably in 2009 and 2010 and then more slowly in the next three years, to arrive in 2013 at 87.1 % of GDP, 25.1 percentage points higher than in 2008. By contrast, Japan’s government debt to GDP ratio increased steadily between 2000 and 2005 before stabilising for two years and then increasing more rapidly through to 2013, by when Japan’s gross government debt was almost two and a half times the level of its GDP. China’s government debt to GDP ratio also increased in 2010, nearly doubling, but fell in subsequent years and by 2013 was 4.7 percentage points above its level in 2009.
Prices
Among the ASEM partners shown in Table 1, Pakistan’s currency (the rupee) devalued most between 2003 and 2013 relative to the euro. By contrast, the Australian, New Zealand and Brunei dollars, as well as the Swiss franc and Czech koruna appreciated most during this 10-year period.
The world inflation rate moved from 3.3 % in 2003 to 9.0 % in 2008 at the beginning of the global financial and economic crisis, before falling to 2.7 % in 2013. The inflation rate for the EU followed a similar development, although price movements were much more subdued. In 2013, inflation rates among the ASEM partners ranged from no change (0.0 %) in Latvia to 7.7 % in Pakistan, with Greece below this range experiencing deflation (-0.9 %) and Mongolia (9.2 %) and India (10.9 %) above this range.
Foreign direct investment
Foreign direct investment (FDI) concerns investment in new foreign plant or similar assets as well as the purchase of existing assets that belong to a foreign enterprise. Unlike portfolio investment, FDI involves gaining control or an effective voice in the management of the direct investment enterprise. The indicators presented in Figures 9 to 11 are averaged over the period 2010–12 as values can vary greatly from one year to the next. The ASEAN members collectively were net recipients of FDI between 2010 and 2012, as were China and India. By contrast, the Republic of Korea, Japan, the Russian Federation and the EU-27 (data for the EU-28 were not available at the time of drafting) all recorded higher net outflows than net inflows.
The main source of net inward FDI to the EU-27 from other ASEM partners between 2010 and 2012 was Switzerland, which contributed 10.0 % of the EU-27’s inward FDI, a share smaller only than that from the United States (46.6 %). Collectively, ASEM partners contributed between one quarter and one fifth of all FDI flowing into the EU-27. By contrast, ASEM partners accounted for around 30 % of the net outward FDI from the EU-27 during the same period. Switzerland’s share was again the largest (9.2 %) and was the third largest destination for EU-27 outward FDI after the United States (27.8 %) and Brazil (9.4 %).
Data sources and availability
The indicators presented are often compiled according to international — sometimes global — standards. Although most data are based on international concepts and definitions there may be certain discrepancies in the methods used to compile the data.
Almost all of the indicators presented for the EU (and its Member States), Norway and Switzerland have been drawn from Eurobase, Eurostat’s online database. In exceptional cases some indicators for the EU have been extracted from international sources.
For the Asian ASEM partners and their aggregates (ASEAN and NESA), the data presented have been extracted from a range of international sources, namely the World Bank, the United Nations Statistics Division, the United Nations Conference on Trade and Development (UNCTAD), the International Monetary Fund (IMF) and ASEAN statistics.
For many of the indicators multiple international statistical sources are available, each with their own policies and practices concerning data management (for example, concerning data validation, the correction of errors, the estimation of missing data, and the frequency of updating). In general, attempts have been made to use only one source for each indicator in order to provide a comparable analysis between the partners.
Aggregates for ASEM, the European ASEM partners and the Asian ASEM partners have been compiled from the data for individual partners as indicated above. As such, they may combine data from Eurostat and international sources.
Context
GDP is the most commonly used economic indicator and provides a measure of the size of an economy, corresponding to the monetary value of all production activities. GDP includes goods and services, as well as products from general government and non-profit institutions within a country (‘domestic’ production). GNI is the sum of gross primary incomes receivable by residents; this is the same as GDP less income payable to non-residents plus income receivable from non-residents (‘national’ concept).
Economic developments can be measured over time by removing the impact of price developments (inflation) to identify the real change in economic activity. Equally, comparisons between countries can be facilitated when indicators are converted from national currencies into a common currency using purchasing power parities (PPP) which reflect price level differences between countries.
See also
- ASEAN-EU - trade and investment statistics
- Asia-Europe Meeting (ASEM) - a statistical portrait
- Asia-Europe Meeting (ASEM) and EU - key statistical indicators
- The EU in the world
Further Eurostat information
Publications
- Goods trade with ASEAN countries rebounds from 2009 to 2010 — Statistics in focus 47/2011
- The EU in the world 2013 — A statistical portrait — Statistical book (2013)
- The European Union and the BRIC countries — Pocketbook (2012)
- The European Union and the Republic of Korea — A statistical portrait — Statistical book (2012)
Database
- Balance of payments, see:
- European Union direct investments (bop_fdi)
- EU direct investments - main indicators (bop_fdi_main)
- Exchange rates, see:
- Bilateral exchange rates (ert_bil)
- Euro/ECU exchange rates - annual data (ert_bil_eur_a)
- Annual government finance statistics (gov_a)
- Government revenue, expenditure and main aggregates (gov_a_main)
- Government deficit and debt (gov_dd)
- Government deficit/surplus, debt and associated data (gov_dd_edpt1)
- Harmonised indices of consumer prices (HICP) (prc_hicp)
- HICP (2005 = 100) - annual data (average index and rate of change) (prc_hicp_aind)
- National accounts, see:
- Annual national accounts (nama)
- GDP and main components (nama_gdp)
- GDP and main components - Current prices (nama_gdp_c)
- GDP and main components - volumes (nama_gdp_k)
- National Accounts detailed breakdowns (by industry, by product, by consumption purpose) (nama_brk)
- National accounts aggregates and employment by branch (NACE Rev. 2) (nama_nace2)
- National Accounts by 10 branches - aggregates at current prices (nama_nace10_c)
- National accounts aggregates and employment by branch (NACE Rev. 2) (nama_nace2)
- GDP and main components (nama_gdp)
Dedicated section
- Balance of payments
- Exchange rates
- Government finance statistics
- Harmonised Index of Consumer Prices (HICP)
- International Statistical Cooperation
- National accounts (including GDP)
Source data for tables and figures (MS Excel)
External links
- ASEM Infoboard – The official information platform of the Asia-Europe Meeting (ASEM)
- European Commission – DG Development and Cooperation - EuropeAid: Building strong and lasting links with Asia
- European External Action Service (EEAS): European Union involvement in the Asia-Europe Meeting
