Archive:Economic globalisation indicators in industry, wholesale and retail trade
- Data extracted in March 2015 Further Eurostat information, Main tables and Database.
In June 2014 Eurostat published a statistics explained article describing the construction of a set of economic globalisation indicators. Eurostat has extended this set of indicators along two dimensions. Firstly the indicators are calculated separately for their intra-EU and extra-EU partners and secondly the indicators are calculated separately for 12 NACE Rev. 2 sections of the non-financial business economy. This article shows graphs for some of the indicators in two NACE sections (Manufacturing and Wholesale and retail trade), illustrating the type of information which could be used to track the different aspects of globalisation.
Main statistical findings
- Economic globalisation indicators are larger for intra-EU partners than for extra-EU partners. This shows the importance of the internal market and also the importance of proximity. We find this for all indicators both in Manufacturing and Wholesale and retail trade although not always for all countries. In the tables presented in this article we have marked the exception in light green. Quite often the exceptions are countries on the outskirt of the EU and are therefore close to extra-EU partners.
- Economic globalisation indicators are larger for Manufacturing than for Wholesale and retail trade. Both in Manufactureing and Wholesale and retail trade enterprises buy and sell products. However in Wholesale and retail trade products are boughtand sold without significantly changing them whereas in Manufacturing the inputs are transformed into final product before they are sold. It is this middle step that is often organised across borders in global value chains and this could account for the fact that globalisation plays a larger role in Manufacturing than in Wholesale and retail trade.
- Another difference found between Manufacturing and Wholesale and retail trade in the ratios between exports and imports. Typically in Manufacturing exports are larger than imports while the reverse is true in Wholesale and retail trade. Possibly this is related to the fact that imports in Manufacturing are relatively cheap raw materials and intermediate products and their exports are more expensive final products.
- Economic globalisation indicators are larger in smaller countries than in larger countries. This is because larger countries have a greater variety of resources and therefore have less need for globalisation. Another influence is that for smaller countries the border is on average closer than for larger countries reducing their transport cost for international trade. We find this inverse relationship between size and globalisation most prominently in Manufacturing and somewhat less clear in Wholesale and retail trade.
There are of course exceptions to these findings that we have indicated in the tables shown in this report. At the same there are many other aspects influencing globalisation such as history, infrastructure, human capital, tax rules, wages and lablors costs, business climate etcetera, but these fall outside the scope of this article.
Economic globalisation indicators are larger in smaller countries
In table 1 we present the correlation coefficients for 9 of the globalisation indicators to the size of the countries (expressed in GVA) broken down by intra/extra-EU partner and by Manufacturing/Wholesale and reatil trade sectors. In Manufacturing we find that all of the correlations are negative suggesting that the smaller countries are more globalised than larger countries. The relation is most clear in imports, exports and foreing controlled employment and turnover and somewhat less in the other indicators. When breaking down for intra-EU and extra-EU the realtion is clearer for intra-EU than for extra-EU. There are two ways in which size effects globalisation. Firstly, larger countries tend to have a greater variety of resources and therefore have less need for international trade. Secondly smaller countries tend to have lower transport costs for international trade than larger countries because for smaller countries on average the border is nearer than for larger countries.
In Wholesale and retail trade the relationship between size and globalisation is less clear. The relation is still visible for imports, exports, inward FDI and employment and turnover in foreign controlled enterprises but not for outward FDI and employment and turnover in foreign affiliates. When breaking down in intra and extra EU the relations generally remain there with the exception of employment and turnover in foreign controlled enterprises where it disappears for the extra-EU part while remaining for the intra-EU part. One factor influencing the intra-EU part is that larger countries because of their size have less of the EU remaining to as partner for the different aspects of globalisation.
International trade in goods
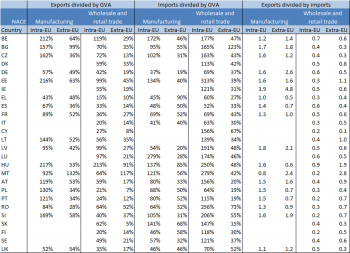
Table 2 shows the exports and imports of goods divided by GVA and the ratio of exports to imports by country. At first sight it seems strange to find ratios of more than 100% in exports and imports divided by GVA. However there is nothing unusual because GVA is calculated using net exports (exports – imports). Thus whenever exports and imports are large compared to domestic consumption, investment and government expenditure, these indicators can very well have values of more than 100%.
When we compare intra and extra EU figures for exports and imports we see that almost always the intra-EU figures are higher than the extra-EU figures underlying the importance of the internal market. The exceptions have been coloured green. The few countries that are exceptions are Greece, Spain, Malta, Finland and the United Kingdom although none of them is an exception for all combinations of exports/imports, manufacturing/trade and intra-EU/extra-EU. They all tend to be on the outskirts of the EU and therefore are likely to have important extra-EU trading partners.
Comparing manufacturing to wholesale and retail trade we see a clear difference in the export and import figures of these sectors. Manufacturing typically has larger shares in exports but in Wholesale and retail trade typically the shares in imports are larger than in exports . A possible explanation is that in Manufacturing, countries in the EU tend to import relatively cheap raw materials and intermediate products while exporting more expensive final products.
The combined effect of lower imports and higher exports in Manufacturing causes for most countries a positive trade balance whereas in Wholesale and retail trade the opposite is true. This can clearly be seen in the last four columns of the table where exports are divided by imports, mostly giving values higher than 100% for Manufacturing and lower than 100% for Wholesale and retail trade.
Foreign direct investment
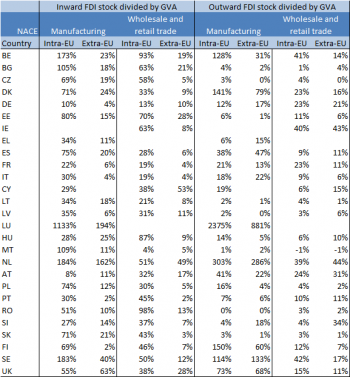
The foreign direct investments from and to EU countries divided by GVA are shown in table 3. Just as for imports and exports of goods, we find for that intra-EU investments divided by GVA are generally higher than extra-EU. This is more prominent in inward investments (first four columns) than in outward investments (last four columns). Comparing FDI between Manufacturing and Wholesale and retail trade we see that in general FDI as a percentage of GVA is bigger in Manufacturing than in Wholesale and retail trade. This seems to be especially the case for most of the larger economies with the exception of Germany.
When comparing inward and outward investments we see that for most countries intra-EU inward investments are larger than outward investments whereas for extra-EU it is the more often the other way around. Since we are looking at aggregated partners (extra-EU and intra-EU) this could be due to the distribution across different economic sectors and different countries.
Differences between small and large economies give a more mixed picture for FDI than they do for imports and exports. As expected large economies such as France, Germany and Italy have low ratios of FDI stocks to GVA but other large economies such as Spain and the United Kingdom have fairly high ratios. It is not clear whether these differences are due to economic phenomena or due to regulatory differences between countries.
Employment and turnover in foreign controlled enterprises
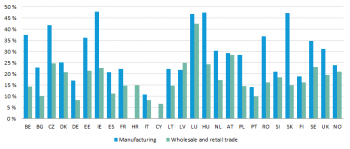
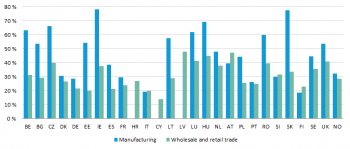
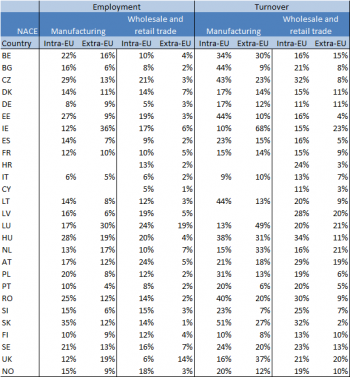
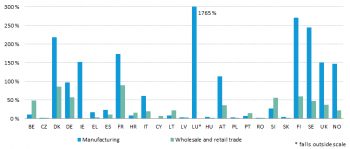
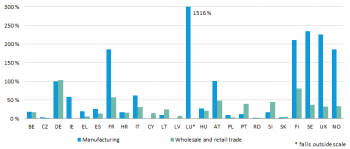
One enterprise is said to control second enterprise when it has 50% or more of the shares in that enterprise. If the controlling enterprise is abroad then we speak of foreign controlled enterprise. Figure 1 and 2 respectively show the share of employment and turnover in foreign controlled enterprises of domestic employment and turnover. The pattern for both is obviously quite similar; countries that have high shares of employment in foreign controled enterprises also have high shares of turnover in foreign controlled enterprises. For almost all countries the shares are higher in Manufacturing than in Wholesale and retail trade, and when the opposite is true the differences are small.
When comparing employment and turnover figures we see in Manufacuring only 2 out of 24 countries for intra-EU partners and 1 out of 24 countries for extra-EU partners have larger values for employment than for turnover. In Wholesal and trade we find 3 out of 22 countries for intra-EU partners and none for extra-EU partners where this is the case. Since both are shares of total domestic employment and turnover this implies a higher rate of turnover to employment for foreign controlled enterprises than for domestic controlled enterprises.
In table 3 the shares have been broken down by intra-EU and extra-EU. As for the other indicators we see that in most countries both employment and turnover in foreign controlled enterprises have higher values for intra-EU than for extra-EU partners . For the few countries where the opposite is true we see that the differences are quite small for Germany and Italy but noticeable for Ireland, Luxembourg and the Netherlands (both intra-EU and extra EU) and the United Kingdom (only intra-EU).
For employment and turnover in foreign controlled enterprises we also find that larger countries generally have higher shares of than smaller countries although there are exceptions on both sides. For the larger countries an exception is the United Kingdom whereas for the smaller countries examples are Finland and Portugal which both have low shares.
Employment and turnover in foreign affiliates
In contrast to foreign control where the controlling enterprise is abroad and controls a domestic enterprises we can also have a domestic enterprise controlling a foreign enterprise. In that case the controlled enterprise is said to be a foreign affiliate. In figure 3 and 4 we show the employment and turnover ratios to domestic employment and turnover in the controlling country.
For these indicators the relation between size seems not be the determining factor. We see in the graphs high values for Luxembourg, the Scandinavian countries and United Kingdom followed by France, Germany and Austria. Therefor it seems to be the case that a more important factor influencing the shares of employment and turnover in foreign affiliates is the cost of labor in the country where the controlling enterprise is located.
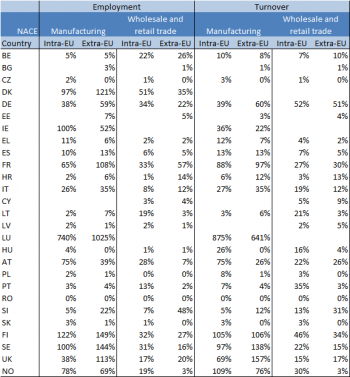
In table 4 we have broken down the shares for extra-EU and intra-EU partners. Again we find only a few exceptions to the facts that globalisation plays a bigger role in Manufacturing-EU than in Wholesale and retail trade. When comparing intra-EU and extra-EU we see that in Wholesale and retail trade more countries have higher intra-EU values than extra-EU. For Manufacturing this still the case for turnover but not for employment.
As before for foreign controlled enterprirses we compared figures for employment to turnover. We find that in Manufacturing 5 out of 22 countries for intra-EU partners and 16 out of 24 countries for extra-EU partners where employment shares are higher than turnover shares. In Wholesale and retail trade we find this in 6 out of 22 countries for intra-EU partners and 9 out of 24 countries for extra-EU partners. Therefor as before for foreign controlled enterprises it is still the case that majority of countries in Wholesale and retail trade have higher values for turnover than for employment. However for Manufacturing this is only true for intra-EU partners while for extra-EU partners more often the share of employment is higher than for turnover.
Research and development (R&D) in foreign controlled enterprises
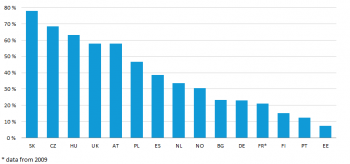
R&D statistics of foreign controlled enterprises are collected for the NACE-sections B to F of the non-financial business economy which does include Manufacturing (section C) but not Wholesale and retail trade (section G). Therefore we only show the indicators for Manufacturing in figures 5.
Shares vary a lot between countries, we find share of over 60% but also shares of under20%. Some relatively small economies such as for Slovakia, Czech Republic and Hungary have high values whereas other such as Finland, Portugal and Estonia are the three countries with the lowest values. Of the larger European economies we see that Germany and France have relatively low shares of around 20% whereas the United Kingdom has a share that is relatively high (58%) with Spain (39%) in between. We therefor see no clear relationship between globalisation and size for this indicator.
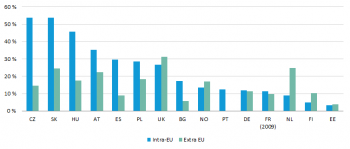
In figure 6 the figures have been broken down by intra-EU and extra-EU partners and the data for 2009 has been added. The three countries with the highest share in intra-EU expenditure in 2011 (Slovakia, Czech Republic, Hungary) are member states that joined the EU in 2002. In contrast in extra-EU expenditure among the four countries (United Kingdom, Netherlands, Slovakia and Austria) with the highest share, three are older member states. All of the countries that joined EU in 2002 or later have higher shares in intra-EU expenditure than in extra-EU expenditure. In the older member states some countries have higher shares in extra-EU expenditure (Netherlands, Portugal, Finland, United Kingdom ) but others have not (Austria, Germany, Spain and France).
Further Eurostat information
Publications
- Foreign affiliates statistics - employment by business function
- Microdata linking - international sourcing
- International sourcing of business functions
- International_trade, investment and employment as indicators of economic globalisation
- International sourcing statistics
- Global value chains - international sourcing to China and India
- Features of International Sourcing in Europe in 2001-2006 - Statistics in focus 73/2009
- International Sourcing in Europe - Statistics in focus 4/2009
- Plans for International Sourcing in Europe in 2007-2009 Statistics in focus 74/2009
Dedicated section
Methodology / Metadata
- Foreign affiliates of EU enterprises - outward FATS (ESMS metadata file — fats_out_esms)
- Foreign controlled EU enterprises - inward FATS (ESMS metadata file — fats_esms)
- European Union direct investments (ESMS metadata file — bop_fdi_esms)
- International trade (ESMS metadata file — ext_esms)
Source data for tables, figures and maps (MS Excel)
Other information
- Commission communication COM/2010/0612 final Trade, Growth and World Affairs Trade Policy as a core component of the EU's 2020 strategy - European Commission, 2010

