Archive:Road safety statistics at regional level
This Statistics Explained article is outdated and has been archived - for recent articles on transport see here.
- Data from November 2014. Most recent data: 2012 Further Eurostat information, Main tables and Database.
This article takes a look at long-term trends in the number of lives lost in road traffic accidents in the European Union (EU), down to the regional level for the latest year available.
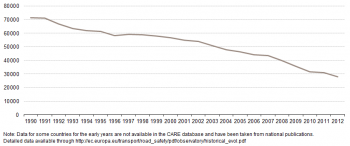
The total number of fatalities in road traffic accidents has decreased by 61 % between 1990 and 2012 (Figure 1) at the level of the EU-28 and by 51 % since the year 2000 (Target expressed in the European Commission’s White Paper: -50% between 2000 and 2010). While a general trend towards less road traffic fatalities can be observed in all individual countries in Europe, there are nevertheless significant variations between individual regions.
An evaluation of the risk of losing one’s live in a road traffic accident is better expressed as a ratio of the number of fatalities per billion vehicle-kilometers. Unfortunately, the traffic performance (expressed in vehicle-kilometres) is not available at regional level. Therefore, the ratio per million inhabitants has been taken as a proxy. This results however in certain particularities, as outlined further in this article.

Source: Eurostat, Eurostat (tran_r_acci) and DG MOVE

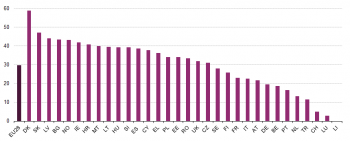
Source: Eurostat, Eurostat (tran_r_acci)

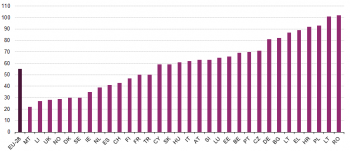
Source: Eurostat, Eurostat (tran_r_acci)

Main statistical findings
Road mobility comes at a high price in terms of lives lost: in 2012, slightly over 28 thousand persons have lost their lives in road accidents within the EU-28.
Nevertheless, the steady decrease in the number of fatalities on Europe’s roads continues; but despite this globally positive tendency (Figure 1), the road death toll is still more than 12 times the total number of fatalities in rail and air transport combined.
The number of road traffic fatalities in the various countries and regions depends on both structural differences (size of the country/region; composition, density and quality of the road network, characteristics of the population) and socio-economic differences (characteristics of the vehicle stock, transit and tourist traffic, behavioural aspects, etc.). In general, improvements in the passive safety of new passenger cars (gradual introduction of safety-enhancing technical devices, improved design for a better protection of pedestrians) may be considered as having a particular positive effect on the reduction of road traffic accident victims.
In absolute terms, the most important decreases in the number of road traffic fatalities between 2008 and 2012 were observed in the following countries (see Figure 2): Denmark (-59 %), Slovakia (-47 %), Latvia (-44 %), Bulgaria, Norway (both -43 %) and Ireland (-42 %). Conversely, decreases were far less important in countries such as Switzerland (-5%) and Luxembourg (-3%).
Apart from Liechtenstein and Malta, both countries very small and therefore difficult to compare with other countries, the lowest numbers of road fatalities per million inhabitants at national level (Figure 3) were recorded in the United Kingdom (28 fatalities per million inhabitants), Norway (29), Denmark (30), Sweden (30) and Ireland (35). On the other side of the spectrum, the highest figures were noted for Lithuania (101) and Romania (102).
Regional risk variation
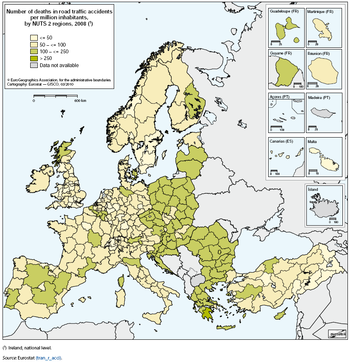
Map 1 shows the number of deaths in road traffic accidents per million inhabitants by NUTS 2 region in 2012.
The relative number road fatalities per million inhabitants is comparatively low in major urban areas and European capitals such as Berlin (12 fatalities per million inhabitants), Vienna (14), London (17), Hamburg (18), Istanbul (18) and Madrid (21)). The fatality rates in less urban regions surrounding the conglomerations are always significantly higher. The low ratios in major urban regions can also be explained by the higher proportion of public transport and the use of other transport modes, such as cycling and walking. While road accidents in general are more frequent in city traffic, lower average speed reduces the probability of serious injuries. However, an increase in the number of accidents involving non-motorised individuals may also lead to an increase in the number of persons injured. The combined effect of lower speeds and of more accidents involving more vulnerable travelers is not clear-cut. The number of road traffic fatalities per million inhabitants in 2012 in the individual NUTS level 2 regions ranged from zero to 170. The figures should be interpreted with care: the two regions that display zero fatalities are in fact the Spanish territories of Ceuta and Melilla, two small exclaves (both with territories under 20 km²) on North Africa’s coast, with a limited road network and a population under 100 000. In 2012, not a single road traffic was registered in these two regions. At the other end of the scale is the Belgian region Province de Luxembourg, with 170 fatalities per million inhabitants. This high number may be explained by the fact that this region is sparsely populated but has the particularity to be crossed by a major road axis with considerable transit traffic. Furthermore, there are a substantial number of cross-border workers (to the neighbouring Grand-Duchy of Luxembourg), generating additional traffic. The low population density and the comparatively dense traffic (and hence a frequency of road traffic accidents) can then result in a high ratio. As mentioned earlier, a ratio based on traffic or transport performance (vehicle-kilometres or passenger-kilometres) would render a better image, but these data are not available at regional level. This being said, the map shows that lowest rates are generally found among regions of the northern and north-western EU Member States (see Table 1). At the other side of the spectrum, the highest rates are found in the eastern and south-eastern European countries. Among the latter, a there are many Greek, Portuguese and Polish regions (see Table 2). These high figures might be partly explained by the quality of the road network and the safety standards of the vehicle fleet. The ranking also displays a certain number of French regions: Guadeloupe and Guyane as French Départements d’Outre-Mer but also the island of Corsica, a popular holiday destination where the number of road accidents generally increases considerably during the summer months.
National totals of fatal road accidents are taken from the CARE database. Apart from Liechtenstein and Malta, both very small and therefore difficult to compare with other countries, the lowest numbers of road fatalities per million inhabitants were recorded by Sweden (43) and most regions in the United Kingdom (43 at national level). They are followed by the Netherlands (46), Switzerland (47), Norway (54) and most German regions, especially the federal states in the west (54 at national level).
Furthermore, the relative number of fatal road accidents at regional level is comparatively low in major conglomerations and European capitals such as Wien (16 fatalities per million inhabitants), Berlin (16), Bremen (18), Oslo (Oslo og Akershus: 22), Stockholm (23), Birmingham (West Midlands: 23), Hamburg (23), Greater Manchester (24), Istanbul (25), Amsterdam (Zuid-Holland: 27), Outer London (27) and Inner London (28). The fatality rates in the more rural areas surrounding the conglomerations are always significantly higher.
With the exception of the candidate country Croatia (150 fatalities per million inhabitants), the highest rates of road deaths are found in the eastern and south-eastern European countries. Among these Lithuania has the highest fatality rate (148), followed by Poland (143), Romania (142), Latvia (139), Bulgaria (139), Greece (138), Slovakia (112) and Slovenia (106). Given the lower level of vehicle ownership still seen in most of these countries, these high figures — compared with western Europe — might partly be explained by the quality of the infrastructure and partly by the age, size and security standards of the vehicles.
Motorway density and risk
Statistically, the numbers of road deaths are particularly low for many regions with high traffic volumes. This is true especially of many regions in western Germany and England, in particular around major cities, and of most parts of the Netherlands. Especially around major cities and transport hubs (e.g. seaports), high traffic volumes cause congestion, which reduces average speeds and, therefore, also the likelihood of fatalities when accidents do occur. A closer look at this phenomenon also reveals that many of these regions tend to have high motorway density. In general, motorways are much safer than secondary roads. Furthermore, mainly transit traffic uses existing motorways, thus keeping the number of road fatalities in these regions relatively low, despite high total traffic volumes. In fact, the quality of the roads in these countries is especially high, contributing to the low number of accidents.
By contrast, fatality rates are high in regions with low motorway density, such as all of Romania, Hungary and the Czech Republic except their capitals, the whole of Bulgaria, Poland, the Baltic Member States, some of the eastern federal states of Germany and many rural areas in France and Spain. These data strongly suggest that the high proportion of traffic using motorways is an important factor behind the low number of road fatalities in many regions.
In addition to the share of the total road network accounted for by motorways, the significant reductions in the number of road deaths are also due to a combination of high in-vehicle and out-of-vehicle safety standards, speed limits and a general ‘safety culture’, including the quality of the emergency and healthcare systems.
The relatively low number of fatal road accidents in most major European cities can also be explained by the higher proportion of public transport and other modes, such as cycling and walking. While road accidents in general are more frequent in city traffic, driving at lower speed reduces the probability of serious injuries. However, an increase in the number of accidents involving nonmotorised travellers could also lead to an increase in the number of serious injuries. Consequently, the combined effect of lower speeds and of more accidents involving more vulnerable travellers is not clear-cut.
Physical geography might be another reason for the differences in per-inhabitant fatality levels. Driving in mountainous regions like the Alps, the Pyrénées and the Carpathians is often more dangerous than in flat areas and therefore leads to a higher number of accidents and fatalities. In addition, these regions attract a high volume of tourist traffic, thus adding to local traffic and, hence, the number of accidents reported per inhabitant.
Data sources and availability
Eurostat collects, compiles and disseminates a variety of regional indicators. Data on road accidents are currently collected by EU Member States and candidate countries on a voluntary basis via annual questionnaires.
All data are annual, with time series going back to 1988.
Regional road safety was addressed by dividing the number of fatalities in road transport by the number of inhabitants per region. In contrast to the data on people injured, the data on road casualties are comparable across Europe.
The precise definitions of all variables used can be found in the 'Glossary for transport statistics'. The basic data used in the map has been extracted from Eurostat’s website.
Context
In response to the growing concern shown by European citizens over road safety, the European Union made this issue a priority of its common transport policy set out in the 2001 White Paper on transport ‘Time to decide’ and its mid-term review in 2006 (‘Keep Europe moving — Sustainable mobility for our continent’). In that White Paper, the European Commission set the target of halving the number of road fatalities between 2000 and 2010. To achieve this objective, a number of steps have been taken, including introducing higher vehicle safety standards, improving the quality of road infrastructure, extending the traffic regulations combined with enforcing the existing regulations and improving driver education.
See also
Further Eurostat information
Publications
Main tables
- Transport see:
- Road transport (t_road)
- People killed in road accidents (tsdtr420)
Database
- Transport, see:
- Multimodal data (tran)
- Regional transport statistics (tran_r)
- Victims in road accidents by NUTS 2 regions (tran_r_acci)
- Regional transport statistics (tran_r)
- National totals of fatal road accidents, see the CARE Database - DG Mobility and Transport
Dedicated section
Methodology / Metadata
- Regional transport statistics (ESMS metadata file — reg_tran_esms)
Other information
External links
- European Commission - Road Safety
- European Commission - Transport - European transport policy for 2010: time to decide (White paper, 2001)
- European Commission - Transport - Keep Europe moving – sustainable mobility for our continent (2006 mid-term review of White Paper)