Archive:Europe 2020 indicators - country profiles
This article is part of a set of statistical articles based on the Eurostat publication Smarter, greener, more inclusive - Indicators to support the Europe 2020 strategy, providing recent statistics on the Europe 2020 strategy of the European Union (EU); it introduces the country articles outlining the situation at national level in relation to the Europe 2020 headline indicators and specific national targets (see list).
Country profiles
The 'Country profiles' section provides a detailed picture of the situation at national level in relation to the Europe 2020 headline indicators and national targets. As already mentioned in the introduction, the Member States have defined their national targets in their National Reform Programmes (NRPs), reflecting the current situation of each country.

Source: Eurostat, see dedicated web section: Europe 2020 indicators dedicated website
The focus lies on summarising the state of play for each Member State in relation to its national targets. Examples of political actions at a national level, as part of the Europe 2020 strategy’s governance mechanism (see the introduction for a detailed description), complement the analysis. The NRPs outline the actions and measures planned in each country to make progress towards the national targets. They are supported by country-specific recommendations issued by the European Commission after the assessment of the national programmes. The complete NRPs and country-specific recommendations can be downloaded from the European Commission’s Europe 2020 website.
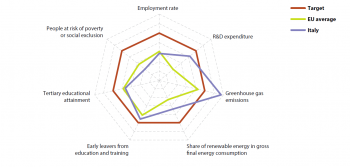
The presentation of each country is supported by an illustration in the form of a radar chart. The chart in figure 1 shows the distance of a country to its national targets relative to the range of distances observed across all Member States and relative to the EU average. This means the closer a country is to the centre of the ‘spider web’ for an indicator, the further it is from the respective national target. Thus the country needs to make more effort than other Member States to meet its national target. On the other hand, the closer a country is to the outer red line of the spider web, the closer it is to its national target. Figures outside the outer red line mean the country has already met this target, thus showing the degree of ‘overachievement’. The green line in the radar chart shows the aggregated EU-27 distance to the overall EU-level targets. The comparison of a country’s performance with the green line reveals whether a country is performing better or worse than the EU as a whole. National targets that are not harmonised with the overall EU targets are not included. For example, this is the case for the national energy efficiency targets, because at the time of writing not all Member States had expressed their targets in absolute levels of primary and final energy consumption in 2020 as requested by the Energy Efficiency Directive.
The national targets (as defined in the NRPs) and the latest available national data for the headline indicators are presented in a separate table. Data on Europe 2020 headline indicators and related issues are disseminated by Eurostat in a dedicated section of its website.
Articles by country
- (alphabetical order: 1st column down, then 2nd, etc. - click on country to access the article)
See also
Further Eurostat information
Publications
Main tables
Dedicated section
Methodology / Metadata
- Towards robust quality management for European Statistics - Communication from the Commission to the European Parliament and the Council COM(2011) 211 final
Other information
- Regulation 223/2009 of 11 March 2009 on European statistics