Archive:The EU in the world - international trade
- Data from February 2014. Most recent data: Further Eurostat information, Main tables and Database. Planned article update: May 2015.
This article is part of a set of statistical articles based on Eurostat’s publication The EU in the world 2014 (to be published).
The article focuses on international trade in the European Union (EU) and in the 15 non-EU countries from the Group of Twenty (G20). It covers key trade statistics for both goods and services and gives an insight into the EU trading patterns in comparison with the major economies in the rest of the world, its counterparts in the so-called Triad — Japan and the United States —and the BRICS composed of Brazil, Russia, India, China and South Africa.

(% of GDP) - Source: Eurostat (bop_q_eu) and (nama_gdp_c), the World Bank (World Development Indicators, based on International Monetary Fund (Balance of Payments Statistics Yearbook and data files), World Bank and OECD (GDP estimates))

(% of GDP) - Source: Eurostat (bop_q_eu) and (nama_gdp_c), the World Bank (World Development Indicators, based on International Monetary Fund (Balance of Payments Statistics Yearbook and data files), World Bank and OECD (GDP estimates))

(EUR billion) - Source: Eurostat (bop_q_eu) and (nama_gdp_c)Source: Eurostat (Comext) and the United Nations (Comtrade)
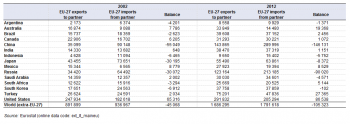
(EUR million) - Source: Eurostat (ext_lt_maineu)
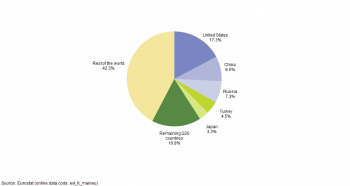
(% share of extra-EU-27 exports) - Source: Eurostat (ext_lt_maineu)
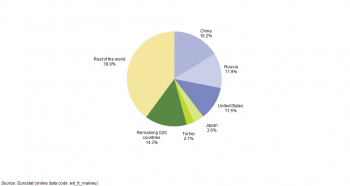
(% share of extra-EU-27 imports) - Source: Eurostat (ext_lt_maineu)
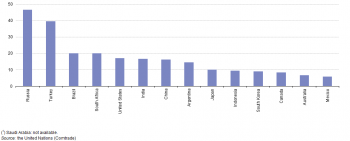
(%) - Source: Eurostat (ext_lt_maineu)Source: the United Nations (Comtrade)
(%) - Source: Eurostat (ext_lt_maineu)Source: the United Nations (Comtrade)

(EUR billion) - Source: Eurostat (bop_its_ybk) and the United Nations (Service Trade)

(EUR billion) - Source: Eurostat (bop_its_ybk)
(% share of extra-EU-27 exports) - Source: Eurostat (bop_its_ybk)

(% share of extra-EU-27 imports) - Source: Eurostat (bop_its_ybk)
Main statistical findings
Trade in goods and services (% of GDP)
For goods, the EU-28 recorded a trade deficit that was 0.4 % of its GDP in 2012
The level of international trade relative to overall economic activity (the ratio of traded goods and services to GDP) may be expected to be considerably higher for relatively small countries that are more integrated in the global economy as a result of not producing a full range of goods and services, as can be seen, for example, with Saudi Arabia and South Korea in Figure 1. By contrast, the United States reported the second lowest ratio of international trade (average of exports and imports) of goods and services to GDP (15.7 %) in 2012 among the G20 members, higher only than that in Brazil (13.2 %). While trade in goods dominates international trade, trade in services has grown strongly: trade in services was equivalent to 7.5 % of GDP in India and reached 9.7 % of GDP in South Korea.
Relative to GDP, Saudi Arabia recorded by far the largest international trade surplus (goods and services combined) in 2012 among the G20 members, its large surplus in goods outweighing its deficit in services by an amount equivalent to 24.0 % of GDP; Russia (7.3 % of GDP) and South Korea (2.7 % of GDP) recorded the next largest trade surpluses. At the other end of the scale, South Africa’s large goods deficit and smaller services deficit combined for a total deficit equivalent to 10.3 % of GDP, larger in relative terms than that for India (-9.7 %) and Turkey (-7.9 %). The EU-28 recorded a trade deficit for goods that was 0.4 % of its GDP, around one third of the size of its 1.2 % of GDP trade surplus recorded for services.
Trade in goods
Close to three fifths of all EU exports of goods in 2012 were destined for G20 members, most notably the United States (17.0 %), China (8.9 %) and Russia (7.1 %)
In 2007, China overtook the United States to become the second largest exporter of goods among the G20 members, behind the EU-28. Despite the strong growth in Chinese exports, the EU-28’s exports of goods in 2012 remained higher — see Figure 2. By contrast, Chinese imports of goods were notably lower than imports into either the EU-28 or the United States. Together, the EU-27, China and the United States accounted for 39.3 % of global exports of goods in 2011 and 43.8 % of global imports.
The EU-28 ran a trade deficit for goods equal to EUR 115.0 billion in 2012; this was the third largest deficit among the G20 members, behind that recorded for the United States (EUR 613.5 billion) and India (EUR 155.2 billion). Table 2 shows the flows and balance of trade in goods for the EU-27 with the other G20 members. In 2012, the EU-27 had relatively large trade deficits with China and Russia, while its largest surplus was with the United States. Between 2002 and 2012 the EU-27’s trade balance for goods with Brazil and South Africa developed from a deficit into a surplus, whereas this situation was reversed with Saudi Arabia. During the same period, the EU-27’s trade deficit for goods with Russia and China increased substantially, more than doubling, while the deficits with South Korea, Japan, Argentina and Indonesia contracted. The EU-27’s trade surplus for goods with Turkey, Australia, India and the United States increased between 2002 and 2012, while those with Mexico and Canada contracted.
Figures 3 and 4 analyse the importance of the other G20 members for the EU-27’s trade in goods. Close to three fifths (57.7 %) of all EU-27 exports of goods in 2012 were destined for G20 members, most notably the United States (17.3 % share), China (8.5 %) and Russia (7.3 %). The EU-27’s main export market outside of the G20 was Switzerland which was the destination for 7.9 % of the EU-27’s exports. Collectively, the G20 members provided just over three fifths (60.1 %) of the EU-27’s imports of goods, with China (16.2 %), Russia (11.9 %) and the United States (11.5 %) the main countries of origin; Switzerland (6.2 %) and Norway (6.0 %) provided similar shares of the EU-27’s imports.
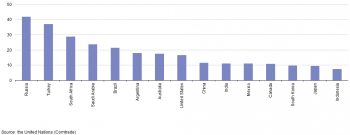
Figures 5 and 6 show the reverse situation, namely the importance of the EU-28 as a trading partner for the other G20 members in terms of international trade in goods. Nearly half of all goods exported from Russia were destined for the EU-28 in 2012, whereas this was the case for less than one tenth of goods exported from Indonesia, South Korea, Canada, Australia or Mexico. The EU-28 was the source of more than one fifth of all goods imported into Brazil, Saudi Arabia, South Africa and Turkey and more than two fifths of goods imported into Russia; the EU-28 supplied less than one tenth of all goods imported into South Korea, Japan and Indonesia.
Trade in services
The EU-27 is the world’s largest exporter and importer of services with a trade surplus of EUR 146.8 billion in 2012
The EU-27 is the world’s largest exporter and importer of services, with a trade surplus of EUR 146.8 billion in 2012. The United States recorded the next highest levels of exports and imports of services (2011 data), as well as the second highest trade surplus for services, valued at EUR 128.3 billion. Among the other G20 countries, only Turkey (2011 data) and South Korea reported trade surpluses for services, while the largest deficits were registered for China, Saudi Arabia (2011 data), Russia and Brazil. Comparing trade flows for 2012 with those for 2002, China, Brazil, Russia, Argentina, South Africa and South Korea all reported that exports and imports of services had more than doubled (in current price terms).
The EU-27 had trade surpluses in services in 2011 and 2012 with all the G20 members listed in Table 4; note that data is not available for those G20 members that are not shown. A relatively high share of the EU-27’s trade in services was with the United States— although exports and imports were broadly in line with each other — resulting in a relatively small surplus in both years. Between 2011 and 2012 the EU’s surpluses with all G20 members expanded.
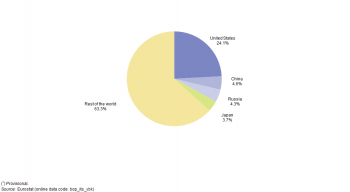
The analysis of the EU-27’s trading partners shown in Figures 7 and 8 for services can be compared with the similar analysis for goods (see Figures 3 and 4). The importance of the United States as a trading partner for the EU-27 for services is notably higher than it was for goods, whereas the reverse was true for China and Russia. Among countries outside of the G20, Switzerland was an important partner for trade in services — it was the destination for 12.7 % of the EU-27’s exports of services and the origin of 11.9 % of the EU-27’s imports of services, in both cases a larger share than that recorded for Russia, China and Japan combined.
Data sources and availability
The statistical data in this article were extracted during February 2014.
The indicators are often compiled according to international — sometimes global — standards, for example, the IMF’s standards for balance of payments statistics. Although most data are based on international concepts and definitions there may be certain discrepancies in the methods used to compile the data.
EU data
Most if not all of the indicators presented for the EU have been drawn from Eurobase, Eurostat’s online database. Eurobase is updated regularly, so there may be differences between data appearing in this publication and data that is subsequently downloaded.
G20 countries from the rest of the world
For the 15 G20 countries that are not members of the EU, the data presented have generally been extracted from a range of international sources, most notably the World Bank and the United Nations. For some of the indicators a range of international statistical sources are available, each with their own policies and practices concerning data management (for example, concerning data validation, correction of errors, estimation of missing data, and frequency of updating). In general, attempts have been made to use only one source for each indicator in order to provide a comparable analysis between the countries.
Context
Globalisation acquires a higher profile when it is measured by actual trade flows. There are two main sources of trade statistics: the first is international trade in goods which provides highly detailed information on the value and quantity of international trade; the second is balance of payments statistics which register all the transactions of an economy with the rest of the world. The current account of the balance of payments provides information on international trade in goods and services, as well as income (from employment and investment) and current transfers. For all these transactions, the balance of payments registers the value of exports (credits) and imports (debits).
See also
- All articles on international trade
- All articles on the non-EU countries
- Other articles from The EU in the world
Further Eurostat information
Publications
- External and intra-European Union trade - Data 2004-09
- The EU in the world 2013
- The European Union and the BRIC countries
Main tables
- International trade in services, geographical breakdown (t_bop_its)
- Market integration by type of trade activities (tec00123)
- Balance of international trade in goods (tec00044)
- Balance of international trade in services (tec00045)
- Annual government finance statistics (t_gov_a)
- Total general government expenditure (tec00023)
Database
- International trade), see:
- International trade data (ext)
- International trade long-term indicators (ext_lti)
- EU trade by Member State, by partner and by product group (ext_lti_ext)
- Extra-EU trade by partner (ext_lt_maineu)
- EU trade by Member State, by partner and by product group (ext_lti_ext)
- International trade long-term indicators (ext_lti)
- International trade detailed data (detail)
- Traditional international trade database access (ComExt) (comext)
- International trade in services, geographical breakdown (bop_its)
- International trade in services - Data for the Eurostat yearbook (bop_its_ybk)
- Balance of payments statistics and International investment positions (bop_q)
- Euro area balance of payments (source ECB) (bop_q_euro)
- European Union balance of payments (bop_q_eu)
- GDP and main components (nama_gdp)
- GDP and main components - Current prices (nama_gdp_c)
Dedicated section
Source data for tables and figures (MS Excel)
External links
- European Commission
- United Nations
- World Bank