- Data from October 2013. Most recent data: Further Eurostat information, Database.
This article provides an overview of statistical data on sustainable development in the area of good governance. They are based on the set of sustainable development indicators the European Union (EU) agreed upon for monitoring its Sustainable development strategy. Together with similar indicators for other areas, they make up the report 'Sustainable development in the European Union - 2013 monitoring report of the EU sustainable development strategy', which Eurostat draws up every two years to provide an objective statistical picture of progress towards the goals and objectives set by the EU sustainable development strategy and which underpins the European Commission’s report on its implementation.
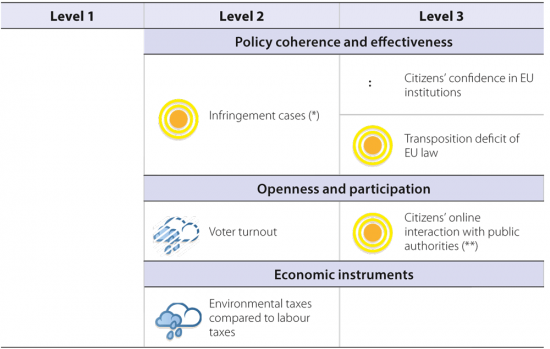
The table below summarises the state of affairs of in the area of good governance. Quantitative rules applied consistently across indicators, and visualised through weather symbols, provide a relative assessment of whether Europe is moving in the right direction, and at a sufficient pace, given the objectives and targets defined in the strategy.
Overview of main changes
The trends observed in the good governance theme since 2000 have been mixed. There have been favourable trends as regards new infringement and the transposition deficit of EU law with respect to Single Market rules. In addition, citizens increasingly interact with public authorities over the internet. Some unfavourable trends, however, persist. Voter turnout in national parliamentary elections continues to decline, and a general shift from labour to environmental taxes, as called for in the EU Sustainable Development Strategy and more recently in the Europe 2020 strategy, has not been achieved.
Main statistical findings
Policy coherence and effectiveness
Citizens' confidence in EU institutions
44 % trust in European Parliament in 2012 keeps it the most trusted among the main EU institutions. Citizens’ confidence in EU institutions remains generally low, but increased again after a historic low
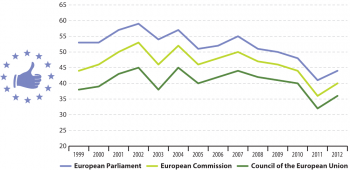
In 2012, less than half of the EU citizens (44 %) said they trusted the European Parliament. However, it was still the most trusted of the three main EU institutions. Even fewer citizens said they trusted the European Commission (40 %) and the Council of the EU (36 %). Trust levels for all three institutions have declined since 2000, but increased in 2012 after reaching a low point in 2011.
- Low trust levels in EU institutions matched by general lack of trust in national political institutions
EU citizens’ trust in political institutions at all levels of government is generally low [1]. EU citizens have the lowest trust in political parties (15 %), national governments (27 %) and national parliaments (28 %). They are more likely to trust regional and local authorities (43 %) and international institutions, such as the United Nations (42 %). Recent reports [2] show that the economic crisis and the following spending cuts (‘austerity policy’), together with the way these were managed, seem to explain much of the lack of trust.
Infringement cases
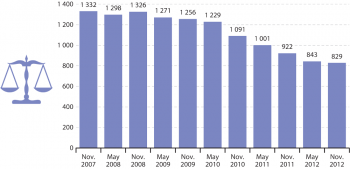
38 % drop in the number of Single Market related infringement cases in the EU between 2007 and 2012. Taxation and environmental issues make up the two largest groups of
infringement cases by policy sector
The number of infringement cases in the EU (cases where Single Market rules are presumed to have been incorrectly applied or incorrectly transposed and where a letter of formal notice has been sent to the Member State in question) dropped considerably between 2007 and 2012. The most notable falls occurred in 2010. The decline continued in the most recent year recorded, falling by 10 % compared to November 2011.
- Considerable differences in infringement cases between policy sectors
There are major differences among individual policy sectors. In the Single Market, the major concerns continue to be mainly in the areas of direct and indirect taxation and environment (water protection and waste management in particular), which made up 44 % of all pending infringement cases in November 2012.
Transposition of EU law
2.4 percentage points drop in transposition deficit of EU law in the EU between 2000 and 2012. This put the EU again below the target for transposition deficit of Single Market rules
Promoted by the Internal Market Scoreboard [3] as the ‘best result ever’, the EU average transposition deficit was 0.6 % in November
2012. It was therefore below the 1.0 % target set by the European Council in 2007 [4] and close to the 0.5 % target proposed by the European Commission in 2011 in the Single Market Act [5]. From 1997 onwards, there has been a decreasing trend from 6.3 % to the mentioned last result of 0.6 %.
In November 2012, only four Member States (Belgium, Austria, Poland and Portugal) did not comply with the 1.0 % target established by the European Council in 2007; moreover, 13 Member States had a transposition deficit of 0.5 % or below and were thus meeting the target proposed by the European Commission in the Single Market Act in April 2011.
- Significant differences in transposition deficit of EU law among policy areas
More than half of the transposition deficit of EU law comes from two fields, namely transport (27 %) and environment (19 %). The remaining fields contribute to this deficit with lower percentages; for example, ‘financial services’ has a 9 % contribution, whilst ‘social policy’ and ‘veterinary and phytosanitary legislation’ have both 7 %.
Openness and participation
Voter turnout
'1.5 percentage points reduction of voter turnout in national parliamentary elections in the EU between 2000 and 2012. The trend from previous years remains confirmed, as the
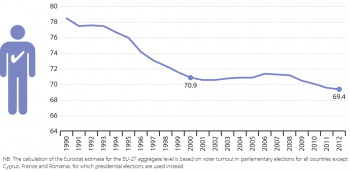
turnover of citizens casting their vote continues to slightly decrease

In 1990, the voter turnout in national elections was 78.5 %. In only ten years, it dropped dramatically by 7.6 percentage points, reaching 70.9 % in 2000. The trend continues with few ups and downs until 2007 when it starts suffering a slight but steady decrease. In fact, between 2007 and 2012, the voter turnout does not experience ups and downs, and slowly loses every year an average of 0.33 % over the whole period of time. However, if comparing year 2000 with 2012, the reduction of voter turnout is represented only by a slight drop of 1.5 %. Many factors influence voter turnout: among these, few seem to have more impact, such as population size and electoral closeness, a more stable population, campaign expenditures, and institutional procedures governing the course of the elections [6]. Nevertheless, the contemporary erosion of voter turnout may be often associated with the particularly high rates of abstention of younger generations in the elections [7].
- Only eight EU Member States with a voter turnout over 80 %
There are major differences among EU Member States participation in national elections. Only eight countries have a voter turnout over 80 %; namely these countries are Malta, Luxembourg, Belgium, Denmark, Italy, Cyprus, Sweden and Austria. A group of eleven countries follows with a percentage of voters casting their vote between 60 % and 80 %. Only three countries experienced a voter turnout smaller than half of eligible voters who actually voted in their country elections.
- Much lower participation in EU parliament elections compared with national elections
The participation in EU Parliament elections is significantly lower than voter turnout in national elections. Although EU composition was completely different, a decreasing trend can be reported with regard to voter turnout in EU parliamentary elections over the past thirty years (1979 to 2009). It signals a loss of almost 20 % of EU citizen participation [8]. In fact, on average, EU-27 voter turnout does not reach half of the eligible EU population, and is estimated at 43 % for the most recent election. In six Member States the turnout fell lower than 30 %, and in one EU country it did not even reach the 20 % threshold. However, in Belgium and Luxembourg more than 90 % of citizens casted their vote in the last two EU parliamentary elections.
The not encouraging performance of the EU parliamentary elections in comparison with the national elections may represent accordingly a second-order elections in which national issues are more salient than EU ones [9]. It may also reflect a lack of information on EU matters among EU citizens [10], as well as a general perception of EU affairs not having a significant impact on national policies and personal interests.
Citizens’ online interactions with public authorities
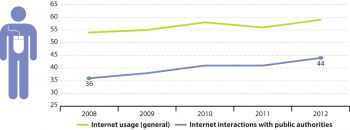
'8 percentage points increase in the online interactions of citizens with public authorities in the EU between 2008 and 2012. Overall, more than 40 % of EU citizens used e-government in
2012
In 2012, 59 % of EU citizens used the internet which marks an increase of 5 percentage points since 2008. Between 2008 and 2012 the use of the internet by EU citizens to interact with public authorities increased even more, by 8 percentage points. After a slight drop in 2011, internet interactions with public authorities grew again, reaching 44 % in 2012.
- How internet interaction with public authorities varies between Member States
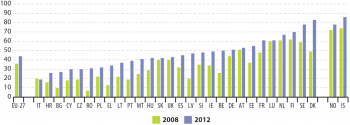
In 2012 internet interaction with public authorities was above 60 % in six countries (Denmark, Sweden, Finland, the Netherlands, Luxembourg and France), whereas it varied between 55 % and 19 % in the remaining Member States. Nevertheless, internet interaction with public authorities increased in all but one Member State between 2008 and 2012. The strongest increases between 2008 and 2012, however from a very low level, took place in Romania (4.4-fold increase), Bulgaria (2.7-fold), and Greece (2.6-fold).
- Differences in internet use affect e-government use across Member States
Although internet coverage of fixed broadband networks was stable in 2012 at 95.5 % of the European population [11], differences in regular internet use by EU citizens were substantial between the Member States. Internet usage ranged from above 80 % in Sweden and Denmark to slightly above 40 % in Croatia and the Czech Republic, with the exception of Italy (33 %).However, most of the growth in the regular use of the internet by EU citizens comes from those Member States that currently have a low level of regular internet use. Therefore, it is argued in the Digital Agenda Scoreboard 2013 that ‘regular internet use continues its road to becoming the norm in Europe’ [12].
- Administrative services are the most popular
The most popular online public services are those providing administrative services for citizens: ‘declaring income taxes’ (73 % of user will use the e-Channel for this service next time), ‘moving/changing address within country’ (57 %) and ‘enrolling in higher education and/or applying for student grant’ (56 %) [13] . The most important gains for citizens when using e-government services are time and flexibility, followed by saving money and simplification of the delivery process. Apparently, service quality is less relevant to citizens [14]. A more sophisticated use of e-government has not emerged (for example direct interaction with government officials and electronic voting) [15] .
Economic instruments
Environmental taxes compared to labour taxes
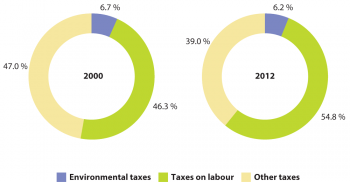
'10.1 % increase in the ratio of labour to environmental taxes in the EU from 2000 to 2011. This trend is counter to the EU goals of shifting the tax burden from labour to energy and

environmental taxes (‘greening’ the taxation system)
Environmental taxation has played an important role in policy debates during the current and previous economic crises. Many have argued that raising environmental taxes could create scope for labour tax cuts and deliver the double dividend of higher employment and a better environment.
In 2000 revenues from labour taxes were about 7.5 times higher than revenues from environmental taxes, while in 2011 they were more than 8.2 times higher. In fact, the share of environmental taxes in total revenues from taxes and social contributions declined over the period from 2000 to 2011, while the share of labour taxes increased. The decrease in the share of environmental taxes was substantial between 2004 and 2008, followed by a slight improvement between 2008 and 2011.
- The effective tax burden on energy has fallen…
This trend is also reflected in the development of the implicit tax rate on energy (ITR). The ITR is measured as ratio of energy tax revenues to final energy consumption and represents the effective tax burden on energy [16] . Energy taxes are the major part of environmental taxes, accounting for almost three quarters of environmental taxes in 2011 [17]. While there was a downward trend between 2000 and 2008, with the ITR falling by 9.7 %, it increased again during the economic crisis, by almost 9 % from 2008 to 2011. This trend mainly mirrors the developments in energy consumption in the EU (see the chapter ‘Sustainable consumption and production’).
The fall in the implicit tax rate on energy indicates a decline in the effective tax burden on energy relative to the potentially taxable base. As with the shares of environmental taxes compared to labour taxes, this trends conflicts with the principle of shifting taxation from labour to environmental and energy taxes as included in the EU Sustainable Development Strategy and the Europe 2020 strategy.
- … while the share of labour taxes in total revenues from taxes and social contributions has increased
The share of labour taxes in total revenues from taxes and social contributions showed a fluctuating but overall increasing trend between 2000 and 2011, reaching almost 55 % in 2011. This compares with an overall decline in the share of environmental taxes over the same period, reaching 6.17 % in 2011. This trend is counter the Europe 2020 strategy’s argument that ‘raising taxes on labour, as has occurred in the past at great costs to jobs, should be avoided’ [18]. Nevertheless, there are large differences in the share of labour taxation among the Member States, ranging from 33.4 % to 58.1 %.
With regards to environmental taxes, only two Member States (Bulgaria and the Netherlands) showed a share above 10 % of environmental taxes in total revenues from taxes and social contributions in 2011, and two others (Malta, Slovenia) had a share above 9 %. In the remaining Member States the share of environmental taxes ranged from 4.15 to 8.94 %.
See also
Further Eurostat information
Publications
- Sustainable development in the European Union - 2011 monitoring report of the EU sustainable development strategy
- Taxation trends in the European Union: Data for the EU Member States, Iceland and Norway - 2010 edition
- Taxation trends in the European Union: Data for the EU Member States, Iceland and Norway - 2011 edition
Main tables
- Good governance (Theme 10)
- Policy, coherence and effectiveness
- Openness and participation
- Economic instruments
Dedicated section
Methodology
- More detailed information on good governance indicators, such as indicator relevance, definitions, methodological notes, background and potential linkages, can be found on page 339-359 of the publication Sustainable development in the European Union - 2011 monitoring report of the EU sustainable development strategy.
Other information
- Commission communication COM(2010) 245 - A Digital Agenda for Europe
- Commission communication COM(2010) 743 - The European eGovernment Action Plan 2011-2015
- Commission report SEC(2008) 556 - Aarhus Convention Implementation Report
- Commission staff working document SEC(2010) 627 - Europe’s Digital Competitiveness Report, vol. 1
- European Commission COM/2001/ 428 - European governance - A White Paper
External links
- European Commission - DG Environment
- OECD - Public Governance and Management
- United Nations - Global issues - Governance
Notes
- European Commission, Eurobarometer 78, Brussels, 2012 ↑
- European Council on Foreign Relations, The continent-wide rise of Euroscepticism, May 2013; ; and Centre for European Policy Studies, Has the financial crisis shattered citizens’ trust in national and European governmental institutions?, CEPS Working Document No. 343, June 2011 (update) ↑
- European Commission, Internal Market Scoreboard No. 26, February 2013 ↑
- The 2001 transposition deficit target of 1.5 % was changed to 1.0 % in 2007 to be achieved by 2009; see EU Council Conclusions March 2007, 7224/1/07 REV 1, para 9. ↑
- Communication from the Commission, Single Market Act: Twelve levers to boost growth and strengthen confidence, COM(2011) 206 final, p. 21 ↑
- Geys, B., 2006, Explaining voter turnout: A review of aggregate-level research, Electoral Studies, vol. 25 (4), pp. 637–663 ↑
- Delwit, P., 2013, The End of Voters in Europe? Electoral Turnout in Europe since WWII, Open Journal of Political Science, vol.3 (1), pp. 44–52. ↑
- http://www.europarl.europa.eu/aboutparliament/en/000cdcd9d4/Turnout-(1979-2009).html ↑
- Schmidt, V. A., 2013, Democracy and Legitimacy in the European Union Revisited: Input, Output and ‘Throughput’. Political Studies, 61: 2–22 ↑
- Farrell, D.M. and Scully, R., 2007, Representing Europe’s citizens? Electoral institutions and the failure of parliamentary representation, Oxford University Press, Oxford ↑
- SCOREBOARD 2013 - SWD 2013 217 FINAL.pdf European Commission, Digital Agenda Scoreboard 2013, SWD(2013) 217 final ↑
- Ibid. ↑
- Benchmark 2012 insight report published version 0.1 _0.pdf European Commission, Public Services Online ‘Digital by Default or by Detour?’ Assessing User Centric eGovernment performance in Europe, eGovernment Benchmark 2012 ↑
- Ibid. ↑
- European Commission, Digital Agenda for Europe Scoreboard 2012 ↑
- The indicator is expressed as an index. Prices are deflated. The implicit tax rate measures the average effective tax burden related to the potential taxable base. ↑
- The other parts are taxes on transport (21 % in 2011) and on pollution and resources (4 % in 2011). ↑
- EN BARROSO 007 - Europe 2020 - EN version.pdf European Commission, Europe 2020 — A strategy for smart, sustainable and inclusive growth, COM(2010) 2020 ↑

