- Data from October 2013. Most recent data: Further Eurostat information, Database.
This article provides an overview of statistical data on sustainable development in the areas of socioeconomic development. They are based on the set of sustainable development indicators the European Union (EU) agreed upon for monitoring its sustainable development strategy.
Together with similar indicators for other areas, they make up the report 'Sustainable development in the European Union - 2013 monitoring report of the EU sustainable development strategy', which Eurostat draws up every two years to provide an objective statistical picture of progress towards the goals and objectives set by the EU sustainable development strategy and which underpins the European Commission’s report on its implementation.
The table below summarises the state of affairs of in the area of socioeconomic development. Quantitative rules applied consistently across indicators, and visualised through weather symbols, provide a relative assessment of whether Europe is moving in the right direction, and at a sufficient pace, given the objectives and targets defined in the strategy.

Main statistical findings
Many of the changes in the socioeconomic development theme’s indicators have been influenced by the financial and economic crises from 2008 and the prolonged recession that followed. The slowdown in economic activity not only directly restrained real gross domestic product (GDP) growth, but also led to subdued investment, increased unemployment and to a lesser extent restrained household saving. The employment trend also deteriorated, although it did stabilise over the past two years. Overall expenditure on research and development (R&D) remained more resilient, but it lacked the impetus to stay on-course to meet its 2020 target. There were also positive developments: labour productivity increased and energy intensity declined. However, it is too early to interpret these trends as major turnarounds. They might reflect delayed economic adjustments or turbulence rather than actual long-term improvements.
Headline indicator
 Real GDP per capita
11.5 % increase in real GDP per capita in the EU between 2000 and 2012. Economic activity picked up in 2010 and 2011, but slowed again the following year
.png)
Before the economic crisis of 2008, GDP per capita in the EU was continually on the rise with an average growth between 1995 and 2007 of 2.4 %. This trend was interrupted by the sudden economic slump, which started in 2008 and fully hit the EU in 2009 with the economy shrinking by 4.8 %. In line with the development of GDP, net national income was also abruptly affected by the economic crisis, falling from EUR 21 500 per inhabitant in 2008 to 20 000 in 2009.
- How does the economy respond to anti-crisis policies?
Decisive policy actions at national and European level in response to the crisis, including rescue packages for the most troubled economies, provision of fiscal stimulus and banking sector support, helped improve confidence and financial conditions for sovereigns and banks [1]. These measures contained some of the gravest short-term economic risks and brought about moderate growth in GDP of 1.7 % and 1.4 % in 2010 and 2011 respectively. In 2012, GDP per capita fell by 0.6 %, mainly as a result of the delayed translation of financial market improvements into easing of private sector borrowing conditions and weak private consumption and investment, stemming from a renewed volatility in market sentiment during this period [2]. The adopted policy measures had a favourable effect on net national income, which started steadily increasing in 2010 and grew overtook pre-crisis levels in 2012.
The EU adopted a number of emergency recovery packages to protect the worst-affected countries from bankruptcy and prevent the crisis spreading to other economies in the region. The first bailout programme, which amounted to EUR 110 000 million, was implemented in May 2010 when Greece requested financial assistance from the EU [3]. Ireland and Portugal requested similar assistance in November 2010 and May 2011, EUR 85 000 million and EUR 78 000 million respectively [4][5]. Spain also received a EUR 100 000 million rescue package in June 2012 to recapitalise its banks [6].
Stabilisation of the banking sectors of the most afflicted countries was another important step in tackling the crisis. This was achieved through a series of EU/IMF support programmes for recapitalisation and restructuring of crisis-hit banks including debt guarantees, equity injections and asset purchases. These measures have been crucial for preserving financial stability across Europe by preventing liquidity from seizing-up in peripheral countries.
In December 2011 economic and fiscal governance in the EU and the euro area was fundamentally strengthened as a reinforced Stability and Growth Pact (SGP) entered into force with new rules for economic and fiscal surveillance. These new measures, the so-called ‘six-pack’ [7], consist of five regulations and one Directive. These aim to strengthen the procedures to reduce public deficits and address macro-economic imbalances.
The ‘two-pack’ is the latest European legislative measure on improving macroeconomic surveillance. It builds on the set of rules already agreed in the ‘six-pack’. The first regulation requires countries to present their draft budgets to the European Commission at the same time each year. The Commission will then have the right to assess and, if necessary, issue an opinion on them. The regulation also proposes closer monitoring and reporting requirements for eurozone countries in the EDP. The second regulation sets out explicit rules and procedures for enhanced surveillance of any eurozone country in distress.
- Growth prospects remain uncertain
Although the most acute economic distress in the EU has been mitigated, real activity is still held back by continued fiscal consolidation measures, weak business and consumer confidence and an uncertain economic outlook. There has also been a noticeable spillover of weakness from peripheral economies into the core. As a result, near-term estimates for potential growth have been marked down. In 2013 growth in GDP per capita is expected to slow down, increasing only by 1.3 % in the EU and by 0.9 % in the euro area compared with 2012 levels. Since GDP growth reflects an economy’s dynamism and job creation potential, weak growth poses a challenge for bringing down high unemployment rates across the EU. However, under the assumption of continued policy efforts for financial market improvements and economic adjustments at the EU and Member State-level, GDP is expected to pick up again and rise by 2.6 % in 2014.
- How GDP growth varies between Member States
While no Member State has remained immune to the financial and economic crisis, recovery has continued to diverge across the EU. In most of Europe growth levels have stabilised, but the drag on economic activity has lingered longer in Greece, Spain, Portugal, Italy, Cyprus, the United Kingdom and Ireland. These countries either had unsustainable pre-crisis balance sheets or real estate property bubbles. Even countries that did not accumulate external imbalances, such as Germany, experienced a deterioration in economic growth as a result of shrinking EU export demand and business uncertainty [8]. Central and Eastern European economies, which already had more stable balance sheets, showed a more sizable growth recovery in the period 2007–2012, despite the noticeable spill-over effects from more troubled economies. Poland performed exceptionally well, being the only EU economy to maintain economic growth even during the crisis. Among other factors, the divergence in economic growth is likely to be affected by cross-country differences in fiscal positions, macroeconomic and structural policies, and continued financial fragmentation in the EU as a result of heterogeneity in debt overhang in the private sector.
- What is the household perspective of economic welfare?
Although GDP per capita is an important and widely used indicator of a country’s economic welfare, the indicator on actual individual consumption (AIC) provides a particular insight into the relative material welfare of consumers in different countries. AIC includes all goods and services purchased directly by households. Luxembourg has the highest AIC level, but this is substantially lower than its GDP. This is because it has a large number of cross-border workers who contribute to its GDP but buy most of their goods and services in their own country of residence. Interestingly, despite having the third largest GDP per capita, Ireland has AIC levels below the EU average. The exceptionally low AIC levels in Bulgaria and Romania — 48 and 49 respectively — are in line with their very low GDP levels.
- EU trends in GDP compared with other countries in the world

Recovery from the global economic crisis in the EU has been slower than in other parts of the world. This is because economic activity was largely subdued by the protracted effects of the euro area crisis and continued strains from fiscal consolidation needs and credit market weaknesses [9]. The United States, which also had large pre-crisis imbalances, has experienced a faster recovery. Large emerging economies without substantial pre-crisis imbalances, such as Brazil, Russia, India and China, grew strongly in the recovery period. OECD projections suggest growth will remain higher in the United States than in the euro area despite strong consolidation efforts, the accommodative monetary policy and the financial sector strengthening [10]. Until around 2020, China is projected to have the highest growth rate, but it could be then surpassed by India [11].
Despite growth rate differentials between the EU and other regions, the EU economy is still the world’s largest. In 2012, the 27 EU Member States together produced a GDP of 16.63 trillion US dollars, followed by the United States, China and Japan. Living standards in the EU, as measured by GDP per capita, remain some of the highest in the world, surpassed only by Australia, the United States, Canada and Japan. Therefore, the high growth rates in other parts of the world — middle-income economies in particular — reflect the fact that they are catching up with Europe and other advanced economies. After reaching a certain level, the high growth rates in China and India are projected to level off, whereas Africa is projected to experience some of the highest growth rates between 2030 and 2050 [12].
Economic development
 Investment
10.5 % reduction in total investment in the EU between 2000 and 2011. This trend was largely driven by a sharp fall in private investment in the aftermath of the economic crisis
The share of GDP used for gross investment in the EU followed the economic cycle. The economic downturn in 2000 to 2003 was marked by a sizable reduction in investment in GDP to a l

ow of 19.9 % in 2003. This was mainly driven by a slowdown in business investment. From 2003 onwards, an expansion in business spending has placed investment spending on a steadily increasing path, with the indicator exceeding the growth rate of GDP. After total investment reached a cyclical peak of 21.6 % in 2007, spending fell sharply in the period 2008 to 2010.
- Crisis hit private investment hardest
The slump in total investment during the economic downturn did not come as a surprise as investment expenditure is normally a highly cyclical and volatile component of GDP. A series of negative economic events — the collapse of real estate and property bubbles, the financial and sovereign debt crises and the following economic recession, and uncertainty about the future of the euro — dampened business and consumer confidence. As a result, the adverse impacts of the crisis became visible in the unprecedented decline in household (– 20 %) and business (– 10 %) investment levels between 2007 and 2011.
In fact, private investment was the hardest-hit component of the EU’s GDP during the economic downturn [13]. As lending standards tightened and consumer wealth declined, due to a fall in asset prices, households saved money instead of spending it on durables and housing [14]. Apart from the high economic uncertainty and large decline in growth expectations, business investment was also affected by the reduced access to finance due to tightened credit conditions, especially for small and medium-sized enterprises [15].
Against the collapse of private investment, government investment experienced a moderate increase — from 2.6 % of GDP in 2007 to 2.9 % in 2009 — as a direct result of countercyclical fiscal measures widely adopted in response to the economic crisis. In 2011, however, at the background of ambitious fiscal consolidation programmes across most Member States, the EU average government investment fell sharply, reaching 2006 levels (2.51 %).
- EU trends in investment compared with other countries in the world
The crisis in private investment against the backdrop of the economic downturn is not an exclusively EU phenomenon. Other major economies, including the United States and Japan, experienced a comparable contraction in private investment between 2007 and 2011. However, in these two countries the negative impact on growth as a result of the sharp fall in investment has been moderated by an increase in private consumption [16]. Furthermore, in line with the EU’s expansionary policy in response to the economic and financial crisis, most major economies around the world embarked on unprecedented stimulus packages, ranging from 6 % of GDP in the United States to 12 % in China [17].
 Household saving rate
0.2 percentage point drop in the household saving rate in the EU between 2000 and 2012. After a sharp increase in 2009 the rate fell significantly as result of slow growth and high household debt in some Member States

The household saving rate climbed to 12.14 % in 2001 as financial distress from the 2000–2003 economic downturn took a toll on consumer spending. This was followed by a prolonged period of steady decline in the saving rate between 2003 and 2007, possibly driven by a combination of low interest rates and low and stable inflation, boosting customer’s demand for credit. The falling trend was again reversed in 2008 with the onset of the economic crisis.
- Households responded to the crisis by saving
The household saving rate is normally very sensitive to uncertainty over the economy and interest rates, so it is not surprising that in 2009 the indicator reached a decade-long high of 13.25 %. Over the period 2010–2012 the household saving rate gradually fell to its pre-crisis level. With households in some Member States still needing to reduce debt and the prospect of fragile employment growth, the household saving rate is expected to remain weak. Furthermore, expectations of continued weak employment growth are likely to exert further downward pressure on households’ disposable incomes and their propensity to save [18].
- How household saving rates vary between Member States
In 2011 the saving rate of households across EU Member States ranged from – 1.6% in Latvia to above 17 % in Luxembourg. The average ho

usehold saving rate was particularly low in Baltic countries (– 1.6 % in Latvia, 1.2 % in Lithuania and 5.6 % in Estonia), Poland (2.1 %) and the UK (6.5 %). The other side of the spectrum was dominated by a number of Northern and Central European countries with household saving rates well above the EU average (17 % in Luxembourg, 16.4 % in Germany and 15.6 % in France). The majority of Member States experienced a reduction in their household saving rate over the period 2000 to 2011, with the most pronounced change being observed in Poland (– 10.2 %). Variations in the household saving rate across countries could be a result of a combination of factors, including among others income tax rate, inflation rate, structure of the pension system, stock and housing prices, and real interest rates.
Innovation, competitiveness and eco-efficiency
 Labour productivity

15 % increase in output per hour in the EU between 2000 and 2012. The continuous increase in labour productivity stalled during the economic downturn before picking up again

slowly in 2010 Worker productivity in the EU increased steadily between 2000 and 2007. After that until 2009 it stalled at about EUR 31 per hour worked. The

slowdown in productivity during the recession might reflect weak investment under conditions of high economic uncertainty, resulting in slow capital accumulation [19]. Weak productivity could also result from companies retaining labour during the downturn, leading to underuse of labour and spare capacity [20]. In 2010 labour productivity rebounded and started growing, albeit at a very low rate. In 2012 output per worker increased to EUR 32.2 per hour against the backdrop of falling GDP. During an economic recovery, productivity initially rises as firms increase the work intensity of employees instead of hiring new workers. However, as firms start taking on more workers this boost in productivity is likely to level off.
- How productivity varies between Member States
Although productivity levels grew in all Member States over the past decade, there is still considerable variation in productivity across Europe. In 2012, Luxembourg, Denmark and Ireland had the most efficient workers, producing an output of EUR 58.2, 52.7 and 50.4 per hour respectively. On the other side of the spectrum, labour productivity in 11 Member States was less than EUR 20 per hour.
The large divergence in productivity rates within the Union has been identified as an important structural weakness and one of the underlying causes of the economic crisis. Internal and external structural adjustment programmes, such as limiting unsustainable residential investments and improving export performance, are taking place in Ireland, Greece, Spain, Cyprus, Portugal and Slovenia. In these countries wage growth did not match productivity gains before the crisis. These measures are expected to rebalance labour productivity, boost competitiveness and improve economic performance [21]. Economies in Central and South-Eastern Europe experienced the most pronounced increases in labour productivity between 2000 and 2012: Latvia (107 %), Romania (90 %), Lithuania (84 %), Estonia (60 %) and Slovakia (57 %).
 Research and development expenditure
About a 9 % increase in R&D intensity in the EU between 2000 and 2011. Although R&D spending stabilised at about 2 % of GDP during the economic downturn, further progress is needed to remain on-track to meet the

2020 target of 3 % of GDP
Over the period 2000 to 2007 R&D expenditure as a share of GDP (‘R&D intensity) was relatively stable in the EU, ranging between 1.82 % and 1.87 %. This development was not in line with meeting the EU SDS target of raising investment in R&D to 3 % of GDP by 2010. Despite the slowdown in economic activity after the crisis, R&D intensity in the EU recorded a slight increase of about 4.2 % and 4.7 % in 2008 and 2009 respectively (compared to the previous year). However, since 2009 it has come to a standstill.
- Increasing public sector R&D investment to stimulate the economy
With the onset of the financial and economic crisis, R&D intensity increased to slightly over 2 % in 2009 as GDP fell more rapidly than overall R&D expenditure [22], and has remained at that level since. Besides the faster fall in GDP, the actions taken by individual EU Member States to step up public R&D investment drove this increase. In 2008, to counteract the impact of the economic crisis, many EU Member States boosted public R&D expenditure to stimulate economic growth and facilitate private R&D investment [23]. Government sector R&D expenditure in the EU grew by 2.9 % from 2008 to 2009, outpacing growth in many other sectors except higher education. Business expenditure on R&D declined by 3.5 % over the same period, due to the economic crisis, although there was a much bigger effect on companies’ net sales and profits[24].
- Post-crisis boost in R&D expenditure of businesses
Contrary to an expected long-term decline in business R&D expenditure following the start of the crisis, spending in the business sector actually started to increase again with growth rates of 4.2 % in 2010 and 4.9 % in 2011. Similarly, increases in R&D expenditure over this period were also observed in the government and the higher education sectors.
- How R&D expenditure varies between Member States
 Figure 9: Total R&D expenditure, by country (% of GDP) - Source: Eurostat (tsdec320)

In 2011, R&D expenditure as a share of national GDP varied between 0.5 % and 3.8 %. Scandinavian countries, including Finland, Sweden and Denmark, had expenditure patterns more than one percentage point higher than the EU average. Out of this group of countries, however, only Denmark managed to reach its ambitious national R&D target under the Europe 2020 framework. Countries in Eastern and Southern Europe continued to lag behind, recording R&D expenditure levels between 1.85 % and 0.48 %. Many Member States recorded a substantial increase in R&D intensity after the economic crisis. This was not only a result of the slowdown in GDP growth, but also reflected government efforts to support economic recovery and long-term growth by boosting public and private funding for R&D.
- EU trends in R&D expenditure compared with other countries in the world
Despite there being some way to go to meet the 3 % target set out in the Europe 2020 strategy, the EU in 2011 was among the top five in the world [25]. Israel was at the forefront concerning R&D expenditure (4.4 % of GDP), followed by the Republic of Korea (3.7 %) and Japan (3.3 %)[26]. Although the United States was also hard hit by the financial and economic crisis, the country continued to provide more funding for R&D (2.8 %) than the EU. However, R&D expenditure of the EU exceeded that of Canada (1.7 %), Russia (1.1 %) and a number of emerging economies such as China (1.8 %) and Brazil (1.2 %)[27].
 Energy intensity

15.5 % drop in energy intensity in the EU between 2000 and 2011. The overall declining trend indicates absolute decoupling of energy consumption from economic growth

Energy intensity — the energy used to produce one unit of economic output — has declined substantially over the past decade. Between 2000 and 2011 energy consumption in the EU fell by 1.6 %, whereas GDP grew by 16.5 %. As a result, energy intensity recorded a drop of 15.5 % over this period, indicating absolute decoupling of energy consumption from economic growth.
Decoupling energy consumption from economic growth is essential for reconciling economic and environmental goals. A lowering of energy intensity can be observed both in the presence of absolute decoupling (energy consumption falls despite economic growth) and relative decoupling (energy consumption grows at a slower pace than economic growth).
- Energy intensity remains responsive to swings in the economic cycles
Changes in energy intensity tend to closely follow the economic cycle. Between 2001 and 2009 (with the exception of 2003) energy intensity fell more or less steadily. This was because GDP grew at a slower rate than gross inland energy consumption during the economic downturn. The rebound in economic growth in the EU in 2010 (+ 2.0 % compared with 2009) was accompanied by a surge in energy consumption (+ 3.4 % compared with 2009). As a result, energy intensity in the EU increased for the first time since 2003, by 1.3 % from 2009 to 2010. However, due to the rapid reduction in energy consumption during the next year while GDP continued to grow, energy intensity in the EU recorded a substantial drop of 5.1 %.
The 15.5 % reduction in energy intensity over the past decade has been influenced by improvements in energy efficiency (both in terms of final consumption and power generation) and a shift to renewables in the power generation mix. The increase in eco-efficiency, which is reflected in reduced energy intensity, has also resulted from structural economic changes within the EU. These include the transition towards a more service-based economy and less energy-intensive and higher value-added industries[28]
Employment
Employment
1.9 percentage point increase in the EU employment rate between 2000 and 2012. As a result of the recent economic downturn the rate has slipped away from its 2020 target path

The share of EU citizens aged 20 to 64 in employment was increasing more or less steadily in the decade before the economic crisis (1997 to 2008), reaching a peak of 70.3 % in 2008. The indicator followed the economic cycle with its usual time lag as adjustments in the labour market took longer time to respond to changes in aggregate demand [29]. In 2009, the economic crisis fully hit the European labour market, bringing the employment rate back to the 2006 level of 69 %. After recording a further drop of 0.5 percentage points in 2010, the employment indicator came to a standstill at 68.5 %, where it remained until 2012. From 2010 to 2011, the EU economy experienced jobless growth, where most GDP growth was driven by increases in productivity and hours worked rather than employment [30]. As a result of this labour market stagnation, the EU has deviated from its path towards the Europe 2020 employment target of 75 %.
- Does better educational attainment increase employability?
Educational attainment levels are an important factor for explaining the variation in activity and employment rates between different groups of the labour force. Employment rates are generally higher for people with better education levels. In 2012, people that had completed tertiary education had a significantly higher employment rate than the EU average, at 81.9 %. In contrast, just slightly more than half (52.2 %) of those with at most primary or lower secondary education were employed. The rate for workers with upper secondary or post-secondary non-tertiary education was in between these levels, at 69.7 %, slightly above the EU

average.
Although the employment rates of different education subgroups have followed the same path over time, people with a lower education level were more vulnerable to job losses during the 2008 economic crisis. This is possibly due to the fact that sectors requiring lower qualification levels, such as the construction industry in Spain, the UK and Ireland, were hit hardest by the economic downturn. In recognition of the importance of educational attainment for job market performance, the EU has adopted headline targets and policy measures for both education and employment as part of the Europe 2020 strategy.
- How employment rates vary between Member States
There is a substantial difference in employment rates across the EU. In 2012, Sweden, the Netherlands, Germany, Austria and Denmark exceeded the EU average employment target of 75 %. But at the same time, other countries were more than 15 percentage points behind the EU average target. The lowest end of the spectrum was dominated by countries in Southern and Eastern Europe, with Greece and Croatia having the lowest average employment rates at 55.3 % and 55.4 % respectively. These low rates are likely to reflect differences in economic development, demographic

trends, labour market structures and policies between Member States, as well as the asymmetric impact of economic shocks.
- Employment in the EU regions
Between 2003 and 2007, gaps in regional employment rates across the EU steadily narrowed, assisted by favourable economic conditions. The reduction in regional disparities might have been driven by a number of factors including increased workforce mobility, less regional specialisation in particular sectors and diminishing regional differences in educational attainment and skills. However, differences in employment rates across regions started growing again following the 2008 economic crisis. In 2012 EU regional disparities in employment reached 2000 levels.

 Unemployment
1.7 percentage points increase in the unemployment rate between 2000 and 2012. More people aged 15 to 74 have become jobless since the onset of the financial crisis in 2007, with youth hit more severely

Between 2000 and 2002 the EU’s unemployment rate was more or less stable at about 8.8 %. Joblessness increased over the next two years, following the economic cycle. Between 2005 and 2008 unemployment was on the decrease, reaching a decade low of 7.1 % in 2008. However, the trend was reversed in 2009 when the economic downturn resulted in a prolonged deterioration of the labour market.
- Unemployment in the EU hits a record high
The economic crisis that took hold of the European economy in 2008 first hit the labour market in 2009. This reflects the normal delay in the response of employment to GDP. Since then the unemployment rate has been steadily increasing, registering an all-time peak of 10.5 % in 2012 in line with the stark GDP contraction. Furthermore, job creation is expected to remain weak against a background of weak economic activity and sluggish recovery. As the economy adjusts to the pre-crisis misallocation and over-investment, further job restructuring is expected before labour markets rebound [31]. Activation policies and promotion of re-training and lifelong learning programmes have the potential to facilitate labour market adjustments by addressing existing occupational and skill mismatches.
- Young people and men were affected most by the labour market downturn
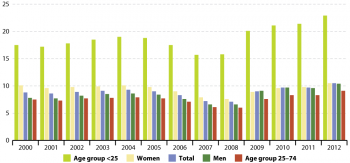 Figure 16: Unemployment rate, by gender and age group, EU-27 (%) - Source: Eurostat (tsdec450,tsdec460)

A closer look at the unemployment indicator shows that young people aged below 25 have been more strongly affected by labour market deterioration than other age groups. Since 2008, joblessness among the young has increased by seven percentage points, reaching 22.9 % in 2012. Long spells of unemployment are particularly harmful for young people because they lead to skill erosion and prevent them from building up work experience. This diminishes their labour market prospects from a very early stage. In light of these developments, young people are a high priority for policy action at the EU and national level.
Since 2000, gaps in the unemployment rates of men and women have been closing up. In 2012, the gender unemployment gap was nearly non-existent, mainly as a result of the pronounced increase in male unemployment compared with a small increase in female unemployment during the economic downturn.
- How unemployment rates vary between Member States
There is a very large difference in the labour market performance of Member States, with the unemployment rate across the EU varying by more than 20 percentage points. In 2012, the countries with the highest unemployment rate were Spain (25.0 %), Greece (24.3 %), Portugal (15.9 %), Croatia (15.9 %) and Ireland (14.7 %). On the other side of the spectrum were Austria, Luxembourg, Netherlands and Germany, with rates between 4.3 % and 5.5 %.
- EU trends in unemployment compared with other countries in the world
In 2012 the EU unemployment rate of 10.5 % significantly exceeded the average for the OECD (8 %), G‑7 [32] (7.4 %) and the United States (8.1 %). Joblessness in the EU was also more than twice as high as in Japan (4.4 %) and Australia (5.2 %) [33]. However, due to the significant spillover effects of the weak growth in advanced economies — Europe in particular — most international labour markets did not stay immune to the economic downturn. According to the International Labour Organization, 20 % of the increase in unemployment in 2012 occurred in advanced economies, whereas the other 80 % was in developing countries. The most pronounced effects were in East Asia, South Asia and Sub-Saharan Africa [34].
See also
Further Eurostat information
Publications
- European economic statistics - 2010 edition
- Renewable Energy Statistics - Statistics in Focus 56/2010
- Science, Technology and Innovation in Europe - Pocketbook 2011 edition
- Sustainable development in the European Union - 2013 monitoring report of the EU sustainable development strategy
- The Social Situation in the European Union 2009
Main tables
- Socioeconomic Development
Dedicated section
Methodology
More detailed information on socioeconomic development indicators, such as indicator relevance, definitions, methodological notes, background and potential linkages, can be found on page 47-79 of the publication Sustainable development in the European Union - 2013 monitoring report of the EU sustainable development strategy.
Other information
- Commission communication COM(2009) 257 - A shared commitment for employment
- Commission communication COM(2008) 876 - Cohesion policy - investing in the real economy
- Commission communication COM(2009) 433 - GDP and beyond: Measuring progress in a changing world
- Commission communication COM(2008) 412 - Renewed social agenda: opportunities, access and solidarity in 21st century Europe
- Commission staff working document SEC(2010) 1276 - European Competitiveness Report 2010
External links
- Report by the Commission on the Measurement of Economic Performance and Social Progress, 2009
- United Nations - Analysing and measuring social inclusion in a global context - New York, 2010
Notes
- International Monetary Fund, World Economic Outlook 2013: Hopes, Realities, Risks, p. 1. ↑
- European Commission, European Economic Forecast, Spring 2013, p. 2 and p. 9; International Monetary Fund, World Economic Outlook 2013: Hopes, Realities, Risks, p. 47. ↑
- European Commission, Directorate General for Economic and Financial Affairs, The Economic Adjustment Programme for Greece, Interim Review, 2010, p. 4. ↑
- Council of the European Union, Council Implementation Decision of Granting Union Financial Assistance to Ireland, 2010, p. 6–7. ↑
- European Commission, Occasional Papers 79, The Economic Adjustment programme for Portugal, 2011, p. 28. ↑
- European Commission, Occasional Papers 118, European Economy, The Financial Sector Adjustment Programme for Spain, 2012, p. 29–30. ↑
- For more information on the specific measures under the ‘six-pack’ see http://ec.europa.eu/economy_finance/articles/governance/2012-03-14_six_pack_en.htm ↑
- European Commission, European Competitiveness Report 2012, Executive Summary, p. 5. ↑
- OECD, Economic Outlook, Vol 2013/1, p. 10. ↑
- OECD, Economic Outlook, Vol 2013/1, p. 11. ↑
- OECD, Economic outlook, Vol 2013/1, p. 194. ↑
- OECD, Environmental Outlook to 2050: The Consequences of Inaction, 2012, p. 46. ↑
- McKinsey Global Institute, Investing in Growth: Europe’s next challenge, 2012, p. 11. ↑
- European Commission, Economic crisis in Europe: Causes, Consequences and Responses, 2009, p. 24. ↑
- McKinsey Global Institute, Investing in Growth: Europe’s next challenge, 2012, p. 4. ↑
- McKinsey Global Institute, Investing in Growth: Europe’s next challenge, 2012, p. 15. ↑
- ILO, A Review of Global Fiscal Stimulus, 2011, p. 2. ↑
- European Commission, European Economic Forecast, Spring 2013, p. 2. ↑
- European Commission, European Economic Forecast, Autumn 2010 ↑
- Among other factors, this might have been caused by the rigid employment protection legislations in many Member States, increasing labour market inflexibility and substituting lay-offs with work-sharing and reduced working hours. ↑
- European Commission, European Economic Forecast, Spring 2013 ↑
- [ http://ec.europa.eu/research/innovation-union/pdf/competitiveness-report/2011/country_review.pdf European Commission, 2011, Innovation Union Competitiveness Report 2011, Belgium, 2011 (p. 64)] ↑
- European Commission, 2011, Innovation Union Competitiveness Report 2011, Belgium, 2011 (p. 65) ↑
- The results are based on a study comprising the world’s top 1 400 companies ranked by their investment in R&D and included in the ‘EU industrial and investment scoreboard’. Data is drawn from the fiscal year 2009. ↑
- Data available at http://data.un.org/Data.aspx?q=Research+and+development+expenditure&d=UNESCO&f=series %3aST_SCGERDGDP. ↑
- 2010 data. ↑
- 2010 data. ↑
- European Environmental Agency, Total primary energy intensity (CSI 028/ENER 017), 2012. ↑
- European Commission, Employment and Social Developments in Europe, 2012, p. 67. ↑
- European Commission, Employment and Social Developments in Europe, 2012, p. 19. ↑
- ILO, Global Employment Trends 2013: Recovering from a Second Jobs Dip, Executive Summary, p. 3. ↑
- G-7 is a group of seven industrialised nations in the world formed by the United States, the United Kingdom, France, Germany, Italy, Canada and Japan. ↑
- OECD data on harmonised unemployment rate. Available online at: http://stats.oecd.org/index.aspx?r=32996 ↑
- ILO, Global Employment Trends 2013: Recovering from a Second Jobs Dip, Executive Summary, p. 1. ↑