Archive:Agricultural census in Bulgaria
- Data from November 2012. Most recent data: Further Eurostat information, Main tables and Database.
This article is part of a series of country-specific essays on the results of the European Union (EU) Farm structure survey (FSS) 2010. The FSS collects information on the structural characteristics of the agricultural holdings (land use, livestock and labour force) and is carried out by all European Union Member States every 10 years as an Agricultural census, with two or three additional, intermediate sample surveys carried out in-between.
The present analysis of the farm structure includes a comparison with the Agricultural census 2003, the first one conducted in Bulgaria in compliance with the EU regulations. In contrast with the FSS 2010, the Agricultural census 2003 in Bulgaria did not include information on common land. As a result, in order to allow comparison between the two reference years, 2010 data presented throughout this article do not include information on common land when the analysis refers to the two waves of the survey. On the contrary, data on common land are taken into account when the analysis concerns the most recent data set.

Source: Eurostat (ef_kvaareg) (ef_ov_kvaa) (demo_pjan) and FSS 2000 and 2010
Source: Eurostat (ef_kvaareg) (ef_ov_kvaa) and FSS 2000 and 2010

Source: Eurostat (ef_kvaareg) (ef_ov_kvaa)

Source: Eurostat (ef_kvftreg)
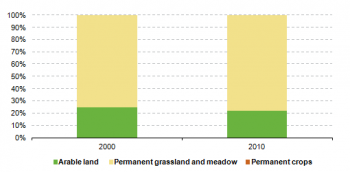
Source: Eurostat (ef_lu_ovcropaa) (ef_oluaareg)
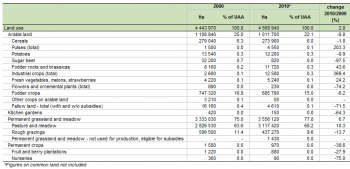
Source: Eurostat (ef_lu_ovcropaa) (ef_oluaareg)
Source: Eurostat (ef_mptenure)

Source: Source: Eurostat (ef_pmhouscatlaa)
Main statistical findings
Key indicators
According to the Agricultural Census 2010, there were 370 220 agricultural holdings in Bulgaria (see Table 1); France (489 980) and Portugal (305 490) recorded similar values. The population of farms decreased considerably (- 44.4 %) in Bulgaria over the inter-census timeframe, as about 295 000 farms ceased their activities.
Between the two reference years, Bulgarian utilised agricultural area (UAA) increased by one fourth (+ 712 480 ha). In 2010, it indicated the value of 3.6 million hectares and was found to cover about 33 % of the entire territory of the country.
In Bulgaria, the combined effect of the decrease in the number of holdings and the increase in the agricultural land resulted in the growth of the average size of the holdings, which more than doubled, from 4.4 ha per farm in 2000 to 9.8 ha in 2010.
The number of people regularly working on the farm dropped below the one million threshold (-45.2 %) in Bulgaria between 2000 and 2010. Nonetheless, in 2010 the agricultural labour force still represented 22.2 % of the active population – one of the highest shares recorded among the EU Member States.
In 2010, the Bulgarian livestock population indicated the value of about 1.2 million livestock units (LSU), a figure which represented a 29.4 % decrease compared to 2003 (- 478 670 LSU). From among the other EU-27 countries, the Czech Republic (1.7 million LSU) and Finland (1.1 million LSU) recorded similar values.
Regional key indicators
As the territorial analysis presented in Table 2 shows, the highest number of farms (109 450) in Bulgaria was recorded within the region of “Yuzhen tsentralen”, which accounted for 30 % of the entire population of the country’s agricultural holdings in 2010. Despite a decrease of 42 % compared to 2003, the territory of “Yugozapaden” registered the second highest value (65 510) and accounted for 18 % of the Bulgarian population of farms. If the agricultural area is taken into account, the territory of “Severozapaden” proved to be the most important, as 21 % of the Bulgarian UAA was recorded within its borders in 2010: + 34 % compared to 2003. In addition, Severoiztochen (738 440 ha) and Yugoiztochen (731 360 ha) recorded similar values and both accounted for 20 %.
As regards farm animals – measured in livestock units (LSU) – the highest number (273 690 LSU) was recorded within the territory of Yuzhen tsentralen, which accounted for 24 % of the entire livestock in 2010; in 2003, the corresponding share was 21 %. Also the region of Yugoiztochen exhibited a remarkable value (219 220 LSU) which corresponded to 19 % of the Bulgarian livestock. In terms of agricultural labour force, about one third (30 %) of employees regularly working on the farm were recorded within the territory of “Yuzhen tsentralen”; in 2003, the corresponding share was 25 %. In 2010, the territory of “Yugozapaden” recorded the second highest value – 125 160 regular farm employees – and accounted for 17 %.
Agricultural holdings
The analysis of the agricultural holdings presented in Figure 1 reveals an interesting peculiarity of the Bulgarian population of farms: it is dominated by two size classes - small holdings with less than 2 hectares of agricultural area on the one hand, and much bigger ones with 100 hectares or more of agricultural land on the other. Although the two together represented 85 % of the total population of farms in 2010, those with less than 2 hectares of agricultural land accounted for only 3 % of the Bulgarian UAA (144 180 ha). On the other end of the scale, the larger farms accounted for 82 % of the agricultural land (3.7 million ha), despite the fact that their number represented only 1 % of the population of farms (5 490) in 2010.
The polarisation of the structure of the Bulgarian agriculture partially derives from the process which took place during the 1990’s, when land was returned to the previous owners or their inheritors. The resulting ownership changes led to a shift in the agrarian structure, as the parcelling of land into small pieces brought about a high degree of fragmentation, on the one hand, and the establishment of large commercial companies on the other hand (Banski, J.) .
See detailed data at NUTS 2 level for 2010 and 2000
Economic size of the farm
The economic size of Bulgarian agricultural holdings was EUR 2 458 million in 2010 – from among the other EU-27 countries, Finland (EUR 3 098 million) and Slovakia (EUR 1 731 million) recorded similar values. The standard output is calculated by adding all the standard output (SO) per hectare of crop and per head of livestock of the farms, and in Bulgaria it indicated an increase of 6.2 % compared to 2007. However, this growth was not recorded for all classes of farms, as holdings with less than EUR 8 000 of SO registered an opposite trend (see Table 3). Almost half of the standard output of Bulgarian farms (42 %) came from large holdings, those with an economic size of EUR 250 000 or more. They indicated the value of about EUR 1 033 million SO in 2010.
Four out of the six NUTS 2 regions of Bulgaria recorded very similar values in terms of the standard output: the territory of “Yuzhen tsentralen” registered the highest share (20 %), followed by “Yugoiztochen” (19.1 %), “Severen tsentralen” (18.3 %) and “Severoiztochen” (18.2 %). On the contrary, the region of Yugozapaden recorded the lowest figure in this respect (7.7 %).
See detailed data at NUTS 2 level for 2010 and 2007
Agricultural holding by main type of farming
In terms of the number of holdings and the main type of farming, the structure of the Bulgarian agriculture appears quite diversified as no major type of production could be identified. However, holdings specialised in the production of various crops and livestock combined (14 %), farms dedicated to dairying (13 %), those specialised in general field cropping (12 %) and the ones dedicated to sheep, goats and other grazing livestock all stood out as the only ones recording double digit shares (see Figure 2) in 2010.
If the economic size is taken into account, the corresponding ranking looks different, as farms specialised in cereals, oilseed and protein crops proved to play a major role: in 2010, they accounted for 38 % of the agricultural standard output of Bulgaria. Farms dedicated to dairying (10 %) as well as those specialised in general field cropping (10 %) were the only other ones recording a double digit share.
See detailed data at NUTS 2 level for 2010
Land use
The Utilised Agricultural Area (UAA) is the total area used by the farm, regardless of the type of tenure or whether it is used as a part of common land. Generally, it included four major components: arable land, permanent grassland and meadow, permanent crops and kitchen gardens.
In Bulgaria, the agricultural area is essentially taken up by arable land (86.4 %) and permanent grass land and meadows (10.6 %). Over the 2003-2010 timeframe, the arable land decreased by 13 % (-466 280 ha); the area of permanent grassland and meadow decreased by 28.4 % (-151 370 ha).
See detailed data at NUTS 2 level for 2010 and 2000
Arable land
In 2010, Bulgarian arable land was essentially dedicated to the production of cereals (1.8 million ha) and industrial crops (1.1 million ha). Cereals covered about half of the country’s agricultural area (-24 % compared to 2003); industrial crops accounted for about 30 % and doubled their value (+ 481 220 ha) within the period under analysis.
See detailed data at NUTS 2 level for 2010 and 2000
Permanent grassland
Although the area of permanent grassland decreased by 28.4 % over the inter-census period (-151 370 ha), it covered 382 020 hectares in 2010 – a value corresponding to 10.6 % of the Bulgarian UAA. Pasture and meadow proved to be its main components (see Table 4), and accounted for 8.7 % of the agricultural area of the country (313 200 ha) in 2010: +210 880 ha compared to 2003.
See detailed data at NUTS 2 level for 2010 and 2000
Livestock
Statistics on livestock use two different units of measurement, the number of heads (number of animals) and the livestock unit (LSU) – the latter allows comparison between different types.
Information in Table 5 indicates that 279 710 holdings farmed about 1.1 million LSU in 2010. Compared to 2003, both the population of farm animals (- 29 %) and the number of holdings with livestock (-53 %) decreased. In 2010, the ration between the livestock and the population indicated the value of 0.15 in Bulgaria. A higher value was registered in 2003 (0.21), as the decrease in the population (-3.6 %) was less sharp than the one in the livestock (-29.4%).
Accounting for 41.2 % of Bulgarian livestock, cattle proved to be the most important farm animals, although their number decreased by 12 % over the period under analysis. Poultry was found to be the second most important livestock, as it accounted for 19.6 % of the country’s farm animal population in 2010 – the corresponding share was 17.6 % in 2003. Also pigs (15.4 %) and sheep (12.3 %) recorded remarkable shares and were the only other livestock that registered double digit percentages in 2010.
Despite the fact that their number halved over the period under analysis, holdings with livestock accounted for 75.6 % of the total population of farms in 2010. This proved to be one of the highest shares recorded among the EU Member States in 2010, although it was much lower than the corresponding figure in 2003 (90.3 %).
The regional analysis of livestock highlighted the importance of the territory of “Yuzhen tsentralen”, which was found to account for 32 % of the whole population of cattle (151 610 LSU) in 2010. If poultry are taken into account, the region of “Severen tsentralen” proved to be the most important with 23 % of Bulgaria’s poultry livestock (52 710 LSU).
See detailed data at Nuts 2 level for 2010 and 2003
Labour force
As presented in Table 6, 738 630 people were regularly working on farms in Bulgaria in 2010. This indicates that, like many other EU Member States, Bulgaria experienced a decrease (- 45.2 %) of the agricultural labour force: there were over one million regular employees of the Bulgarian agricultural sector in 2003. If the annual work unit (AWU) is taken into account, the decline of the agricultural labour force appears even sharper: from 766 440 AWU in 2003 to 389 110 AWU in 2010 (- 49.2 %).
In terms of the sole holders and the gender distinction, the cleavage between genders showed signs of reduction: if 81 % of the sole holders proved to be men in 2003, the male share decreased to 76 % in 2010.
See detailed data at NUTS 2 level on holders' age and gender for 2010 and 2003
See detailed data at NUTS 2 level on type of labour force for 2010 and 2003
Management practices
Type of tenure
According to the Agricultural census 2010, 64.7 % of the Bulgarian agricultural area (2.9 million ha) was farmed by the tenants. Percentages much higher than the national average were recorded in “Severoiztochen” (75.8 %) and “Severen tsentralen” (73.6 %).
Since in Bulgaria no land was recorded as utilised in partnership by the landlord and the sharecropper under a written or oral share-farming contract, the remaining 35.3 % of UAA was found to be farmed by the owners. The territories of “Yugozapaden“ (68.9 %) and “Yuzhen tsentralen” (48.5 %) stood out as they recorded values much higher than the country’s average (see Table 7).
Animal housing
In 2010, there were 95 870 holdings farming 586 380 heads of cattle in Bulgaria; from among the other EU-27 countries, Ireland (11 000) and Lithuania (93 050) recorded similar values.
In terms of the number of both places (425 130) and farms (57 460), the most common type of animal housing in Bulgaria proved to be the one where animals are tied stable with solid dung and liquid manure.
The total number of places exceeded the number of heads of cattle, which serves to explain why the related percentage shown in Table 9 is more than 100.
Other gainful activities
As presented in Table 10, there were 4 180 farms with extra source of income in 2010 in Bulgaria. These farms, which registered activities other than farm work, directly related to the holding and having an economic impact on the holding, accounted for 1.1 % of the entire population of farms; from among the other EU Member States, Latvia (4 170) and Czech Republic (3 440) recorded similar values.
Information on other gainful activities was collected by eleven category types depending on their characteristics; one holding could register more than one activity. Contractual work (2 740 farms) was found to be the most common type of extra activity: it could be recorded either as contractual agricultural work (2 650 farms) and contractual non-agricultural work (260 farms).
The highest number of holdings with other gainful activities (1 340) was recorded within the territory of “Yuzhen tsentralen”, as it accounted for 32 % of the total population of farms with extra source of income.
See detailed data at NUTS 2 level for 2003
Data sources and availability
Methodological notes Bulgaria – Agricultural census 2010
The Agricultural Census 2010 was the first one to be conducted after Bulgaria’s accession to the European Union (2007) and the second one carried out in compliance with the EU legislation. The responsible body was the Ministry of Agriculture and Food (MAF), which conducted the FSS 2010 together with the regional governors and the mayors of the municipalities.
Survey on agricultural production methods (SAPM)
In 2010 a unique survey was carried out together with the Agricultural census, the Survey on agricultural productions methods (SAPM). This survey collected data at regional level needed to establish agri-environmental indicators as indicated in COM final 508/2006 final and to evaluate the greening of the Common Agricultural Policy.
Data were collected according to the specifications listed in Annex V of the above mentioned regulation, namely data on tillage methods, soil conservation, landscape features, animal grazing, animal housing, manure application, manure storage and treatment facilities and irrigation.
In Bulgaria, the SAPM was conducted as an exhaustive survey together with the Agricultural census 2010.
Reference period
Information on the structure of Bulgarian agriculture was collected as of the 31st of August 2010. In addition, data on the labour force and grazing animals were collected with reference to the 12 months prior to this date, whereas information on the agricultural area refers to the 1st of October 2009 – 30th of September 2010 period. Figures on rural development and the average irrigated area refer to a longer timeframe, i.e. the years 2008, 2009 and 2010.
Threshold for agricultural holdings
In Bulgaria, agricultural holdings with at least 0.5 hectares of UAA were taken into account. Given the characteristics of the Bulgarian agriculture, farms falling below this threshold but complying with a set of different physical thresholds related to the hectares of certain types of crops or heads of cattle were also included in the target population.
Common land
Common land is the land that does not directly belong to any agricultural holding but on which common rights apply. It can consist of pasture, horticultural or other land. The treatment of the common land used by an agricultural holding might differ from country to country.
In Bulgaria, information on the area of common land was included for the first time within the context of the FSS 2010: it indicated the value of 858 563 hectares – about 19 % of the Bulgarian agricultural area – and proved to be used collectively by 191 000 holdings, mainly for animal grazing.
Geo-reference of the holding
Information on the location of the agricultural holdings in Bulgaria was obtained through the coordinates of the related administrative-territorial units.
Economic size
From FSS 2007 onward, the Standard output (SO), a new classification of the economic size of the holding, is used. The SO has replaced the Standard gross margin (SGM) used before. Nonetheless, for comparability reasons, in FSS 2007 both classifications are available.
Other methodological issues
In Bulgaria, the Agricultural census 2003 did not include information on common land. Since data on common land were included in the FSS 2010, information on common land was filtered out of the 2010 data set when the two waves of the FSS were compared. On the contrary, whenever the present analysis took into account only the most recent data, figures on common land were included.
Context
European Commission Rural development policy aims to improve competitiveness in agriculture and forestry, the environment and the countryside as well as the quality of life in rural areas, and to encourage the diversification of rural economies.
As agriculture has modernised and the importance of industry and services within the economy has increased, so agriculture has become much less important as a source of jobs. Consequently, increasing emphasis is placed on the role farmers can play in rural development, including forestry, biodiversity and the diversification of the rural economy, in order to create alternative jobs and provide environmental protection in rural areas.
The FSS continues to adapt in order to provide timely and relevant data to help analyse and follow these developments.
Further Eurostat information
Publications
- Agriculture, fishery and forestry statistics — Main results – 2010-11 - 2012 edition
- Farm Structure Survey in Ireland - 2007 - Issue number 20/2009
- Farm Structure in Ireland - 2005 - Issue number 6/2007
- Structure of Agricultural Holdings - Ireland 2003 - Statistics in focus 36/2004
Main tables
- Agriculture, see:
- Structure of agricultural holdings (t_ef)
Database
- Agriculture, see:
- Structure of agricultural holdings (ef)
Dedicated section
Methodology / Metadata
- Structure of agricultural holdings (ESMS metadata file - ef_esms)
- Methodological Report – FSS 2010 Ireland
- Methodological Report – FSS 2007 Ireland
Source data for tables and figures (MS Excel)
Other information
- Regulation 1166/2008 of 19 November 2008 on farm structure surveys and the survey on agricultural production methods and repealing Council Regulation 571/88
- Regulation 1200/2009 of 30 November 2009 implementing Regulation 1166/2008 on farm structure surveys and the survey on agricultural production methods, as regards livestock unit coefficients and definitions of the characteristics

