Archive:Labour market policy expenditure
- Data from November 2010, most recent data: Further Eurostat information, Main tables and Database.
This article analyses recent statistics on labour market policy expenditure in the European Union (EU). In 2008, somewhat more than 200 billion (thousand million) euro was spent on labour market policies (abbreviated as LMP); this amounts to 1.6 % of EU-27 gross domestic product (GDP). There was, however, considerable variation between Member States with expenditure ranging from 3.3 % of GDP in Belgium to only just over a quarter of one percent in Romania and Estonia.
Main statistical findings

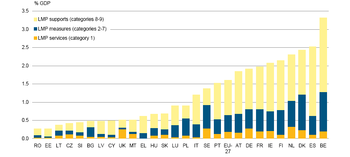
Across the EU, a total of 200 560 million euro, or 1.6 % of EU-27 GDP was spent on labour market polices in 2008. There was, however, considerable variation between Member States with expenditure ranging from 3.3 % of GDP in Belgium to only just over a quarter of one percent in Romania and Estonia.
A major part of LMP expenditure (60 %) goes on income support for out of work jobseekers – primarily unemployment benefits – with most of the rest going on interventions to help them into work. The base level of expenditure on LMP in each country is not closely if at all tied to the level of unemployment but is governed by other economic, political and historical factors. However, changes in expenditure through time correlate much more closely with changes in the level of unemployment and the 19 % fall in the number of people unemployed in the EU between 2005 and 2008 was accompanied by a 14 % fall in expenditure on LMP (when measured at constant price levels).
The statistics shown are based on Eurostat's LMP database, which collects information on labour market interventions from administrative sources in all of the EU-27 Member States and Norway. The timeliness of data depends on national accounting procedures and in some cases there is a significant delay before the annual data are finalised, particularly those relating to expenditure. As a result, data for all countries are only available 18-20 months after the reference period. It is anticipated that 2009 data will be published in June 2011. LMP data are routinely used for monitoring of the European Employment Strategy and, in particular, the efforts of each country to support the unemployed through active and passive labour market policies.
Labour market policy expenditure relative to GDP
Expenditure on LMP accounts for 1.6 % of EU-27 GDP
In 2008, public expenditure on labour market policies in the European Union amounted to just over 1.6 % of total EU-27 GDP, though there was considerable variation between Member States (Figure 1). LMP expenditure was highest in Belgium where it amounted to 3.3 % of GDP, some way above the level observed in all other countries with the next five highest spending countries (Spain, Denmark, Finland, the Netherlands, and Ireland) consuming between 2 and 2.5 % of GDP.
However, the majority of EU countries spent far less. While eighteen countries spent less than the overall EU figure, only nine countries spent more than the EU average. Fifteen countries spent less than 1 % of GDP on LMP. It is noticeable that this group of fifteen includes all 12 countries that acceded to the Union in 2004 or later, with the three low-spending exceptions from the EU-15 group of countries being Greece, Luxembourg and the United Kingdom.
Components of labour market policy expenditure
LMP supports account for 60 % of total LMP expenditure
LMP interventions are organised into three main types – services, measures and supports. LMP services (category 1: labour market services) cover the costs of publicly funded services for jobseekers together with all other expenditure of the public employment services (PES)[1]. Expenditure on LMP services in 2008 represented around 12 % of total LMP expenditure (Figure 2) or 0.19 % of EU-27 GDP (Figure 1), with only four countries spending more than a quarter of one percent of GDP (the Netherlands, Sweden, Germany and the United Kingdom). The United Kingdom is the only country where more than half of LMP expenditure (52 %) is spent on LMP services. This reflects the policy approach to focus on support for active job-search and to reserve placement on full-time measures for those most in need.
Active LMP measures to promote the integration of the unemployed and other disadvantaged groups (categories 2-7: training, job rotation/job sharing, employment incentives, supported employment and rehabilitation, direct job creation and start-up incentives) accounted for 28 % of total LMP expenditure in 2008, roughly two and a half times the expenditure on LMP services or 0.45 % of EU-27 GDP. The level of spending on LMP measures in 2008 was highest in Belgium (1.1 % GDP) and in Denmark (1 %). LMP measures were the most important element of expenditure in Bulgaria (56 %), Poland (52 %) and Sweden (47 %) but accounted for less than 10 % of the total in Malta and the United Kingdom.
However, the largest part of LMP expenditure in the EU – almost 60 % of the total or just under 1 % of EU GDP – went on passive LMP supports (categories 8-9: out-of-work income maintenance and support and early retirement). The vast majority of this money (over 90 %) goes on cash payments to support the unemployed during active job-search (category 8, i.e. mostly unemployment benefits). Moreover thirteen Member States did not spend anything on early retirement benefits (category 9) in 2008. Expenditure on passive income support accounted for the largest share of LMP expenditure in twenty three Member States (Figure 2) and exceeded 70 % of total expenditure in five cases (Cyprus, Greece, Estonia, Spain and Latvia).
Relationship with unemployment
The level of LMP spending is only partly related to the level of unemployment
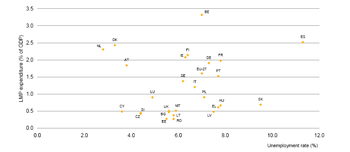
Given that such a large part of LMP expenditure relates to the payment of unemployment benefits it might be expected that the level of expenditure would be closely linked to the level of unemployment in each country. However, plotting LMP expenditure as a percentage of GDP against the unemployment rate (Figure 3) actually shows basically no correlation as there are too many outliers to produce a reasonable relationship. For instance, in 2008, Austria, the Netherlands and Denmark all spent relatively high shares of GDP on labour market policies despite low levels of unemployment (all below 4 %). Meanwhile, Slovakia and, to a lesser extent, Hungary, Greece and Latvia all spent relatively little on LMP even though unemployment was quite high.
In other words, spending on LMP is not linked only to levels of unemployment but also to historical and economic factors as well as current government policy. The relatively low levels of LMP spending prevalent in the 12 new Member States (Figure 1) reflect, at least in part, a combination of the relative wealth of each country, the relative generosity of social benefits, and (where relevant) the extent to which public intervention in the labour market has developed since the transition from centrally planned to free market economies.
Evolution over time
In real terms, LMP expenditure fell by more than 14 % between 2005 and 2008
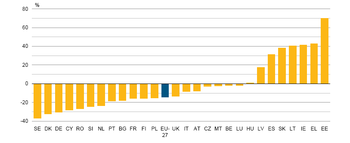
Changes in expenditure through time that are measured in terms of current prices reflect not only changes in the volume of goods and services purchased but also changes in prices and are therefore difficult to interpret and compare. Expressed at constant price levels, i.e. taking into account changes in the price level, EU-27 LMP expenditure fell by more than 14 % between 2005 and 2008. However, this trend was not uniformly observed across the EU (Figure 4). In six Member States expenditure on LMP in real terms increased by more than 30 % over the same period and in Estonia the increase was as much as 70 %. Meanwhile, at the other end of the scale, LMP expenditure declined by more than 30 % in Germany, Denmark and Sweden.
Impact of fall in unemployment
Moreover, the fall in LMP expenditure can be linked to the fall in unemployment
Breaking down the expenditure into the main types shows that between 2005 and 2008 EU-27 expenditure on LMP services and LMP measures fell by only 8 % and 4 % respectively whilst expenditure on LMP supports fell by nearly 20 %. The large decrease in the amounts spent on passive LMP supports is not surprising. The period 2005-2008 was one of significant economic growth around Europe and it resulted in an extra 10.8 million people in work and a fall of nearly 4 million (19 %) in the number of people out of work (Source: Eurostat - Labour force survey, (lfsa_pganws)). Although not all people considered as ILO unemployed[2] are eligible to receive unemployment benefits, the majority are and this is reflected in a decline in benefit expenditure that is of a similar magnitude to the fall in unemployment.
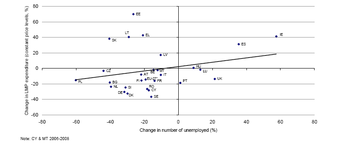
Plotting the change in LMP expenditure between 2005 and 2008 against the change in the numbers of people unemployed in each country does indeed show a reasonable correlation (Figure 5). In general, the countries that experienced rising unemployment also increased LMP expenditure whilst those in which unemployment fell show a coincident decrease in LMP expenditure. The correlation would be stronger were it not for four outliers where LMP expenditure increased significantly despite falling unemployment – Estonia, Greece, Lithuania and Slovakia. It is likely that the increased LMP expenditure in these countries reflects labour market policy reforms, either in general or for specific programmes. For example, in Estonia in 2007 the rate of the state unemployment allowance and the minimum level of unemployment insurance benefits were more than doubled from 400 EEK per month (around 25 Euro) – a rate that had been payable since 1999 – to 1 000 EEK per month (64 Euro) (European Industrial relations observatory on-line). Clearly such a large increase in the amount payable per month to each unemployed person more than offsets any reduction in overall costs as a result of lower numbers of claimants.
From the above analysis it can be concluded that the base level of LMP spending in a country is hardly if at all linked to the level of unemployment because it also depends on other economic and historical factors. However, from the base level of expenditure, changes through time are generally positively correlated with changes in the level of unemployment but this link can be overridden by significant policy reforms.
Training and employment incentives
Training and employment incentives account for 63 % of expenditure on active measures
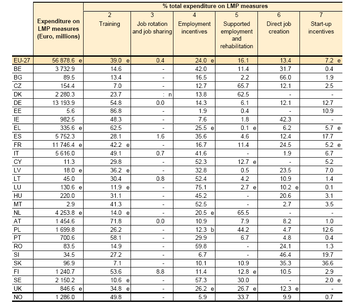
The use of active labour market measures to improve the employability of people who are out of work and to facilitate transitions to employment is an important element of the European Employment Strategy but the types of programmes used vary between countries. Across the EU, expenditure on training (category 2) accounted for 39 % of the expenditure on LMP measures, followed by 24 % on employment incentive measures (Table 1).
Training was the most important type of measure used in eleven Member States. Of the remaining sixteen Member States, nine spent most on employment incentives (category 4), four on supported employment and rehabilitation measures (category 5), two on direct job creation (category 6), and only Slovakia spent most on start-up incentives (category 7).
Activation efforts
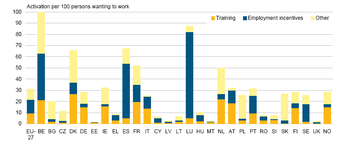
Activation in LMP measures averages 31 per 100 persons wanting to work
As part of the process of monitoring the European Employment Strategy, LMP data are used to measure the efforts that countries make to help people in the transition from unemployment or inactivity into work. Indicators measure inputs in terms of levels of expenditure and in terms of activation, or the proportion of those needing assistance who are helped by LMP interventions. The potential targets for LMP measures are the unemployed and inactive people who do not qualify as unemployed because they are either not actively seeking work or not immediately available for work but who would nevertheless like to work. Together these groups are known as the population wanting to work and the regular activation indicator measures the number of people participating in LMP measures (categories 2-7) in relation to this proxy target population.
In 2008, regular activation (i.e. activation in LMP measures in categories 2-7) averaged just over 31 per 100 persons wanting to work. Of this number, around 70 % were participating in either training (31 %) or employment incentive measures (39 %). It should be noted, however, that the indicator is not a true proportion. In some types of LMP measure the participants may be considered as employed and therefore not part of the denominator (i.e. the population wanting to work), and where this type of measure is widely used the values for regular activation may be surprisingly high. This is particularly true in the case of employment incentive measures that significantly impact on the activation figures for Belgium, Spain and most notably in Luxembourg, but may also be true for supported employment measures and some forms of direct job creation. In other words, the indicator shows the number of people benefitting from LMP measures in relation to a best estimate for the target population but the very fact that they are benefitting from LMP assistance means that some participants are no longer part of that target group.
Data sources and availability
The statistics shown are based on Eurostat's LMP database, which collects information on labour market interventions from administrative sources in all of the EU-27 Member States and Norway. The timeliness of data depends on national accounting procedures and in some cases there is a significant delay before the annual data are finalised, particularly those relating to expenditure. As a result, data for all countries are only available 18-20 months after the reference period. It is anticipated that 2009 data will be published in June 2011. LMP data are routinely used for monitoring of the European Employment Strategy and, in particular, the efforts of each country to support the unemployed through active and passive labour market policies.
The Labour market policy (LMP) database
Labour market policy (LMP) statistics provide information on labour market interventions, which are government actions to help and support the unemployed and other disadvantaged groups in the transition from unemployment or inactivity to work. LMP interventions are defined as: "Public interventions in the labour market aimed at reaching its efficient functioning and correcting disequilibria and which can be distinguished from other general employment policy interventions in that they act selectively to favour particular groups in the labour market."
The scope of LMP statistics is limited to public interventions which are explicitly targeted at groups of persons with difficulties in the labour market: the unemployed, persons employed but at risk of involuntary job loss and inactive persons who would like to enter the labour market.
Each country has a different approach to LMP and implements interventions that are customised to the situation of the national labour market and the different groups of people that are struggling to find work. Information on national interventions is collected annually from administrative sources in each country and is then categorised according to the Eurostat LMP methodology in order to ensure that the information on LMP interventions undertaken across Europe is presented in a way that is as consistent and comparable as possible between types of interventions and countries and through time.
Three different types of intervention are recognised:
- services refer to labour market interventions where the main activity of participants is job-search related and where participation usually does not result in a change of labour market status;
- measures refer to labour market interventions where the main activity of participants is other than job-search related and where participation usually results in a change in labour market status; an activity that does not result in a change of labour market status may still be considered as a measure if the intervention fulfils the following criteria:
- the activities undertaken are not job-search related, are supervised and constitute a full-time or significant part-time activity of participants during a significant period of time, and
- the aim is to improve the vocational qualifications of participants, or
- the intervention provides incentives to take-up or to provide employment (including self-employment);
- supports refer to interventions that provide financial assistance, directly or indirectly, to individuals for labour market reasons or which compensate individuals for disadvantage caused by labour market circumstance.
Classification of interventions by type of action:
- LMP services: 1 Labour market services;
- LMP measures (~ active interventions): 2 Training; 3 Job rotation and job sharing; 4 Employment incentives; 5 Supported employment and rehabilitation; 6 Direct job creation; 7 Start-up incentives;
- LMP supports (~ passive interventions): 8 Out-of-work income maintenance and support; 9 Early retirement.
Expenditure by type The LMP database collects data on the public expenditure associated with each intervention. For each intervention, the expenditure required should cover the whole of transfers and foregone revenue provided to the direct recipients as a result of the intervention. Any other indirect costs are considered as part of the administration costs of an intervention and should be reported in sub-category 1.2 Other activities of the PES only.
This expenditure may include:
- transfers in the form of cash payments or reimbursements;
- the value of directly provided goods and services;
- amounts of revenue foregone through reductions in obligatory levies.
Context
LMP interventions provide assistance to the unemployed and other groups facing difficulties entering the labour market. The LMP data collection was developed by the European Commission (EC) as an instrument to monitor the implementation and development of targeted employment policies across the EU in response to two agreements of the European Council in 1997. The first, held in Amsterdam in June 1997, confirmed that whilst employment policy should be a national responsibility, it was also an issue of common concern and that there should be a coordinated strategy at a European level. The second, held in November 1997 in Luxembourg – the so-called 'Jobs Summit' – launched the European employment strategy (EES) in which LMPs had a key role in relation to employability. Since that time, LMP statistics have been used to monitor both active and passive interventions in the labour market and, in particular, relevant areas of the employment guidelines as set out under the Lisbon strategy.
Within the new Europe 2020 strategy, the flexicurity approach aims to result in the provision and implementation of active LMPs while ensuring adequate benefits for those out of work. The concept of flexicurity came to the forefront of the EU’s employment agenda in 2007 when the European Commission released a Communication titled ‘Towards common principles of flexicurity – more and better jobs through flexibility and security’ (COM 2007/359), which highlighted the idea of reconciling flexibility in the labour market with security for workers. Within this modern flexicurity approach, security refers not only to security of income (for example, through the provision of adequate unemployment benefits) but also to securing people’s capacity to work by ensuring lifelong access to opportunities to develop and adapt their skills to meet new demands in the labour market. Hence, the Europe 2020 strategy specifically refers to the provision of active LMPs, which cover LMP measures and LMP services, and modern social security systems, which include LMP supports. These policies for labour market are, therefore, key instruments within the Europe 2020 strategy and a series of indicators based on LMP data continue to be used for monitoring progress.
Further Eurostat information
Publications
- Labour market policy - Expenditure and participants - Data 2008
- Labour market policy expenditure fell by more than 14% in real terms between 2005 and 2008 - Statistics in focus 66/2010
- 1 in 10 of the population wanting to work took part in labour market training in 2006 - Statistics in focus 34/2009
- An average of just over 822 000 people were benefitting from direct job creation measures - Statistics in focus 76/2009
- Labour market policies (LMP) - expenditure and participants 2007 - Data in focus 23/2009
- Nearly 2% of EU-27 Gross Domestic Product spent on labour market policies in 2006 - Statistics in focus 94/2008
Main tables
- Labour market policy
- Main tables
- Labour market policy (t_lmp)
- Public expenditure on labour market policies, by type of action (tps00076)
- Public expenditure on labour market policy measures, by type of action (tps00077)
- Public expenditure on labour market policy supports, by type of action (tps00078)
- Participants in labour market policy measures, by type of action (tps00079)
- Beneficiaries of labour market policy supports, by type of action (tps00080)
- Persons registered with Public Employment Services (tps00081)
- Labour market policy (t_lmp)
- Main tables
Database
- Labour market policy
- Database
- Labour market policy (lmp)
- Public expenditure on labour market policy (LMP) interventions (lmp_expend)
- Participants in labour market policy (LMP) interventions (lmp_particip)
- LMP based indicators for monitoring the Employment Guidelines (lmp_indic)
- Persons registered with Public Employment Services (PES) (lmp_rjru)
- Labour market policy (lmp)
- Database
Methodology / Metadata
- Labour market policy (ESMS metadata file - lmp_esms)
- Labour market policy database – Methodology – Revision of June 2006
- Addendum to the 2006 LMP methodology, March 2009, see Dedicated section: Labour market policy
Other information
Source data for tables and figures (MS Excel)
External links
See also
- Labour market introduced
- Labour market participation by sex and age
- Labour market policy interventions
Notes
- ↑ The scope of PES activities varies between countries and this should to be taken into account when comparing expenditure on LMP services between countries. For example, in some countries the PES is responsible for the administration of unemployment and other social benefits whilst in other countries these costs are borne by separate benefit organisations and not included in the LMP data. The LMP questionnaire requests that the costs of jobseeker services are separated from other costs of the PES but at the present time this breakdown cannot be made for a significant number of countries.
- ↑ ILO unemployed = people who are out of work (not even 1 hour of work in the reference week), available for work and actively seeking work.
