Archive:Agricultural census in Germany
- Data from November 2012. Most recent data: Further Eurostat information, Main tables and Database.
This article is part of a series of country-specific essays on the results of the European Union (EU) Farm structure survey (FSS) 2010. The FSS collects information on the structural characteristics of the agricultural holdings (land use, livestock and labour force) and is carried out every 10 years as an Agricultural census by all the EU Member States, with two or three additional, intermediate sample surveys carried out in-between. The present analysis of the German farm structure includes a comparison with the previous (2000) Agricultural census.

Source: Eurostat (ef_kvaareg) (ef_ov_kvaa) (demo_pjan) and FSS 2000 and 2010
Source: Eurostat (ef_kvaareg) (ef_ov_kvaa) and FSS 2000 and 2010
Source: Eurostat (ef_kvaareg) (ef_ov_kvaa)
Source: Eurostat (ef_lu_ovcropaa) (ef_oluaareg)
Source: Eurostat (ef_lu_ovcropaa) (ef_oluaareg)

Source: Eurostat (ef_mptenure)

Source: Source: Eurostat (ef_pmhouscatlaa)
Main statistical findings
Key indicators
In 2010, 299 100 agricultural holdings were recorded in Germany; among the other EU Member States, Portugal (305 270) and Lithuania (199 910) registered similar values. Compared to the FSS 2000, when 399 350 farms were recorded, one fourth of the German holdings ceased their activity (- 100 250).
On the contrary, the utilised agricultural area (UAA) remained fairly stable (-1.4 %) over the inter-census decade, indicating the value of 16.7 million of hectares in 2010: in absolute terms, the UAA decreased by 240 660 ha in ten years. Hence, in 2010 the agricultural land was found to cover 47 % of the German territory, which was one of the highest shares within the EU-27.
Given that the number of holdings decreased and the agricultural land remained stable, the average area per farm grew remarkably (+ 31.6 %) in Germany – from 42.4 hectares per holding in 2000 to 55.8 ha in 2010. This meant that Germany, whose agricultural structure had already proved to be characterised by broad farms in 2000, recorded one of the highest values within the EU-27 in 2010.
Over the inter-census timeframe, the number of persons regularly working on the farms decreased by about one fourth. Hence, in 2010 the value for the aforementioned indicator fell under the 1 million threshold. In absolute terms, about 268 000 persons left the agricultural sector between the two reference years, so 749 740 persons were found to be regularly working on the farms in 2010. Accordingly, in 2010 the German agricultural labour force represented 1.8 % of the active population , one of the lowest values recorded among the EU Member States.
The German livestock population – expressed in livestock units (LSU) – indicated the value of 17.8 million in 2010 – one of the highest figures registered within the EU-27 alongside France where it stood at 22.7 millions LSU. Compared to the FSS 2000, a decrease of 1.4 millions LSU was observed (- 7.2 %).
Regional key indicators
The regional analysis exhibited in Table 2 further details the structure of the German agriculture. If the number of holdings is taken in to consideration, the territory of Bayern appears to be the most important, as about one third of the German farms (97 870) was recorded within its borders. The second highest value was recorded in Baden-Württemberg (44 510) and corresponded to 15 % of the German agricultural holdings. Other remarkable figures were registered in Niedersachsen (41 730) and Nordrhein-Westfalen (35 750): the former territory accounted for 14 % of the German population of farms and the latter for 12 %. The metropolitan region of Berlin-Bremen-Hamburg , which merges data from these three urban areas, proved to be marginal and accounted for 0.3 % of the German agricultural holdings: in 2010, only 1 010 farms were recorded within its borders.
In terms of the agricultural area, the south-eastern region of Bayern recorded the highest value, as it accounted for over 3 million hectares – 19 % of the whole German UAA in 2010. The territory of Niedersachsen registered the second highest figure (2.6 million hectares) and accounted for 15 % of the total agricultural area, the very same share recorded in 2000. The regions of Nordrhein-Westfalen (9 %), Baden-Württemberg (8 %) and Mecklenburg-Vorpommern (8 %) recorded very similar values and were found to be the closest to the 10 % threshold. On the other end of the scale, the metropolitan area of Berlin-Bremen-Hamburg (24 760 ha) proved to be marginal, as it accounted for only 0.1 % of the country’s agricultural area in 2010: the very same share recorded in 2000.
In terms of animal livestock, the territory of Niedersachsen proved to be the most important one: 4.5 million LSU were registered within its boarders, a value corresponding to 25 % of the German farm animal population. The southern-east region of Bayern recorded the second highest value (3.6 million LSU) and shared 20 %, whereas the only other remarkable value (2.8 million LSU) was found in Nordrhein-Westfalen, which accounted for 16 % of the German livestock population in 2010.
As regards the labour force, the south-eastern region of Bayern showed the highest number of persons working on farms (219 010), corresponding to 29 % of the total agricultural labour force in 2010. The south-western region of Baden-Württemberg recorded the second highest figure (110 850) and accounted for 15 %; Niedersachsen (13 %) and Nordrhein-Westfalen (11 %) recorded similar values.
Finally, the regional analysis of the average area per holding shows large differences among the territories and highlights the peculiarity of the region of Mecklenburg-Vorpommern (286 ha per farm), Sachsen-Anhalt (278 ha), Brandenburg (238 ha), Thüringen (215 ha) and Sachsen (145 ha). All these regions displayed values much higher than the national average of 56 hectares in 2010.
Agricultural holdings
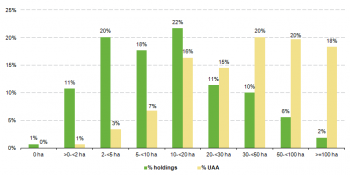
About half (47 %) of the German agricultural holdings reported 5 to 29.9 hectares of UAA in 2010: these medium-sized farms covered roughly 2 million hectares of agricultural land, a value that corresponded to merely 12 % of the whole German UAA. On the other hand, 130 340 farms (44 %) recorded 30 hectares or more of UAA and accounted for 87 % of the German agricultural area (over 14 million of hectares) in 2010. Furthermore, 27 360 farms recorded less than 5 hectares of UAA in Germany: in 2010, these small sized agricultural holdings covered 54 000 hectares and represented less than 1 % of the German agricultural land.
As exhibited in Figure 1, farms with 10 to 19.9 hectares of UAA were the most common as they represented 21 % of the entire population of holdings (63 160). In terms of the number of holdings, the second highest share was reported by farms with 5 to 9.9 hectares of UAA (47 310), which represented 16 % of the German agricultural holdings in 2010. A very similar share was registered by holdings with 30 to 49.9 hectares of agricultural area (15 %).
In Germany, a decrease in the number of holdings was found to affect all the categories of farms, with the exception of the biggest ones, i.e. farms with 100 hectares or more of UAA. Indeed, within the inter-census decade, these quite big holdings recorded a remarkable growth (+ 38 %).
See detailed data at NUTS 2 level for 2010
Economic size of the farm
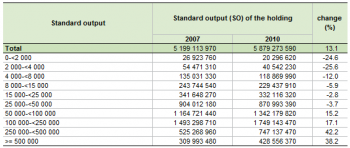
The economic size of all the German agricultural holdings (see Table 3) indicated the value of EUR 41 494 million, one of the highest figures recorded within the EU-27 in 2010. Nonetheless, compared to the FSS 2007, this value – calculated by adding all the standard output (SO) per hectare of crop and per head of livestock of the farms – represented a 5.6 % decrease.
Agricultural holdings with an economic size of EUR 500 000 or more were found to be the most important ones as they accounted for 37 % of the German economic output in 2010. Also farms with an economic output of EUR 100 000 to 249 999 appeared significant, as they accounted for one fourth of the country’s standard output in 2010. The aforementioned classes of farms proved to be on a negative trend compared to 2007, although in both cases the decrease reported was found to be below the national average value of -5.6 %.
The territorial analysis of the economic output of the farms reveals the importance of the territories of Niedersachsen and Bayern, as together they accounted for about 40 % of the German standard output in 2010. In particular, Niedersachsen reported the highest share (21 %), whereas Bayern accounted for 19 %, a value that corresponded to EUR 7 698 million.
See detailed data at NUTS 2 level for 2010 and 2007
Agricultural holding by main type of farming
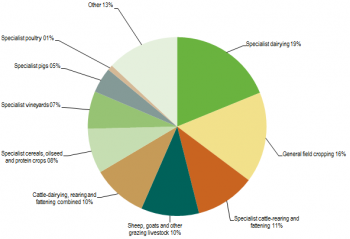
In terms of the main type of farming, holdings specialised in dairying were found to be the most common in Austria: as exhibited in Figure 2, they represented 18.8 % of the total population of farms in 2010. The second highest share was recorded by farms specialised in general field cropping (16.4 %). Holdings dedicated to cattle-rearing and fattening (10.8 %), those specialised in sheep, goats and other grazing livestock (10.5 %) and farms dedicated to cattle-dairying, rearing and fattening combined (9.9 %) recorded very similar values.
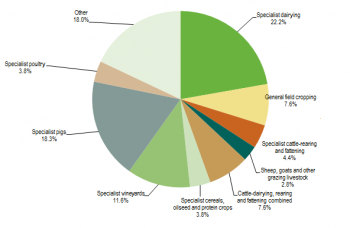
If the economic size of the holdings is taken into account, the ranking takes on a different perspective, though farms specialised in dairying (22.2%) maintain their prevalence within the structure of the Austrian agriculture. Holdings specialised in pigs recorded the second highest share (18.3 %), followed by farms dedicated to vineyards (11.6 %) and those dedicated to general field cropping (7.6 %).
See detailed data at NUTS 2 level for 2010
Land use
The Utilised Agricultural Area (UAA) is the total area – taken up by arable land, permanent grassland and meadow, permanent crops and kitchen gardens – used by the holding, regardless of the type of tenure or whether it is used as a part of common land.
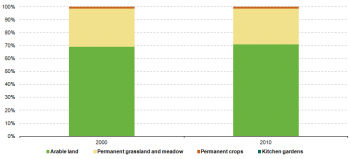
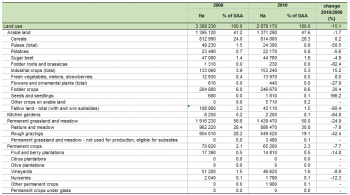
In Austria, the UAA is essentially made up of arable land and permanent grassland and meadow: together these two components accounted for 98 % of the country’s agricultural area in 2010. Compared to 2000, arable land increased its share over the total agricultural area (from 41.2 % to 47.6 %), although in absolute terms it decreased by about 24 000 hectares. On the contrary, the relative weight of permanent grassland and meadow decreased, from 56.6 % to 50 % (-500 000 hectares in absolute terms).
See detailed data at NUTS 2 level for 2010
Arable land
In 2010, arable land was taken up by cereals, fodder crops and industrial crops. Cereals were found to cover the widest area (814 800 hectares) and accounted for 28.3 % of the entire Austrian UAA. Fodder crops covered 246 670 hectares – a value corresponding to 8.6 % of the country’s UAA – while industrial crops accounted for 5.3 %.
See detailed data at NUTS 2 level for 2010
Permanent grassland and meadow
Despite decreasing by about 500 000 hectares during the inter-census decade, the land dedicated to permanent grassland and meadow represented half of the Austrian agricultural area in 2010. In particular, in absolute terms the area dedicated to pasture and meadow decreased marginally (-76 000 ha) while actually increasing its share over the total UAA, from 28.4 % to 30.8 %. On the contrary, the area dedicated to rough grazing dropped by 404 490 hectares and indicated the value of 549 520 hectares in 2010 (19.1 % of the country’s UAA).
See detailed data at NUTS 2 level for 2010
Livestock
Statistics on livestock can be measured in livestock units (LSU) or number of heads (number of animals), with the LSU allowing comparison between different types.
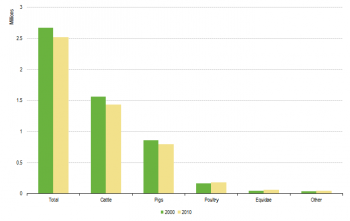
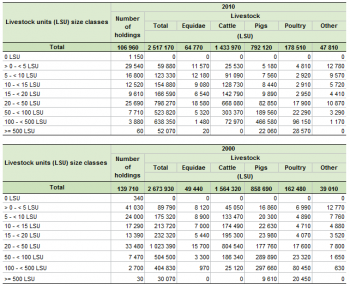
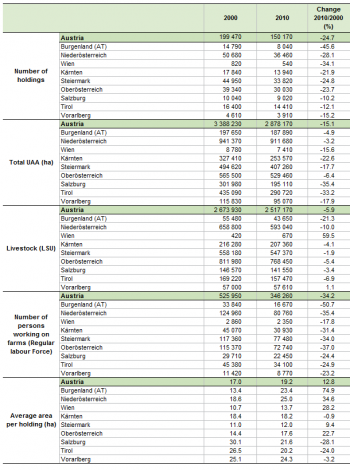
In Austria, the number of livestock decreased by 6 % within the inter-census period. Thus, it indicated the value of 2.5 million LSU in 2010: among the EU Member States, Belgium (3.8 million LSU) and Hungary (2.5 Million LSU) recorded similar values.
Cattle were by far the most common type of livestock, as they accounted for 57 % of the total population of farm animals in 2010. In particular, 1.4 million LSU of cattle were recorded, a figure which represented an 8.3 % fall compared to 2000. Also pigs recorded a remarkable share, as they accounted for about one third of the whole country’s population of farm animals in 2010: in absolute terms, their value dropped over the years, from 858 690 LSU to 792 120 LSU.
In Austria the number of livestock per inhabitant dropped, from 0.33 in 2000 to 0.30 in 2010. This was the combined effect of the increase in the population (+ 4.7 %) and the fall in the number of livestock (- 5.9 %). Conversely, as the decrease in the number of holdings with livestock was lower than (-23.4 %) the fall in the population of farms (24.7 %), the share of holdings with livestock over the population of farms grew: from 70 % in 2000 to 71 % in 2010.
Similarly to a great number of EU Member States, the decrease in the number of holdings in Austria was observed mainly for farms with few LSU. In particular, farms with 5 to 9 LSU displayed the highest fall (- 30 %), followed by farms with 15 to 19.9 LSU (28 %) and those with 10 to 14.9 LSU (-27 %).
As already mentioned, the regions of Niederösterreich, Steiermark and Oberösterreich together accounted for 76 % of the Austrian population of farm animals in 2010. In particular, 768 450 LSU were recorded in Oberösterreich (30 %), 593 040 LSU were registered within the borders of Niederösterreich (24 %) while 547 370 livestock units were recorded in Steiermark, a value which corresponded to 22 % of the entire population of livestock.
See detailed data at Nuts 2 level for 2010 and 2000
Labour force
In Austria, the agricultural labour force dropped by -34.2 % over the 2000-2010 timeframe: whilst 525 950 persons were regularly working in agriculture in 2000, only 346 260 were left in 2010. As displayed in Table 6, the decrease was even sharper (-38.05 %) in terms of the annual work unit (AWU), with figures dropping from 179 460 AWU in 2000 to 111 180 AWU in 2010.
A regional analysis of the agricultural labour force confirms the relevance of Niederösterreich, Steiermark and Oberösterreich within the context of Austrian agricultural structure. Indeed, about 23 % of the persons regularly working on farms were registered within the territory of Niederösterreich; Steiermark accounted for 22 % of the regular agricultural labour force; further 21 % was recorded within the borders of Oberösterreich.
See detailed data at NUTS 2 level on holders' age and gender for 2010 and 2000
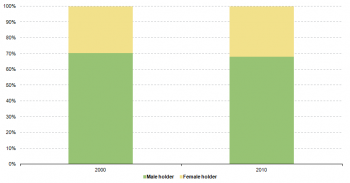
In terms of sole holders, the gender cleavage showed signs of decrease over the period under analysis: 69 % of sole holders in Austria were found to be male in 2000, whereas the percentage recorded in 2010 was 66 %.
See detailed data at NUTS 2 level on type of labour force for 2010 and 2000
Management practices
Type of tenure
In 2010, the vast majority of the Austrian agricultural area (64.5 %) was found to belong to the farmers who actually worked on that land (see Table 7). Another relevant share of agricultural land (31 %) proved to be farmed by tenants, whereas the portion of land utilised in partnership by the landlord and the sharecropper under a written or oral share-farming contract was found to be marginal (4.6 %).
Animal housing
According to the FSS 2010, there were 71 940 holdings farming about 2 million heads of cattle in Austria. Most of these farms (70.1 %) hosted cattle in stanchion tied stable with solid dung and liquid manure. The type of housing where animals are hosted loose with solid dung and liquid manure was also very common, as it was recorded in 39.4 % of the farms and accounted for 586 710 places (29 %).
As in many other EU Member States also in Austria the total number of places (2 386 850) exceeded the number of heads of cattle. Accordingly, the hosting capacity of the country was not fully exploited in 2010, which explains why the related percentage was more than 100.
Other gainful activities
According to the Agricultural census 2010, 56 070 holding recorded other gainful activities in Austria. These holdings, which recorded activities other than farm work, directly related to the holding and having an economic impact on it, represented 37.3 % of the Austrian population of farms. The aforementioned values rank Austria among the EU Member States with the highest number of farms with extra source of income in 2010.
A regional analysis again reveals the relevance of the territories of Niederösterreich, Steiermark and Oberösterreich, as the highest numbers of farms with other gainful activities were recorded within their borders. In particular, 13 130 farm with extra source of income were recorded in Steiermark, a value which accounted for 23 % of the population of farms with other gainful activities. Furthermore, 11 250 holdings with extra source of income were found in Niederösterreich (20 %) and 9 550 (17 %) were registered in Oberösterreich.
Information on other gainful activities was collected by eleven category types depending on their characteristics and each holding could register more than one activity.
As many Austrian holdings include forest land, forestry work was found to be the most common source of extra income in 2010 (see Table 9) – it was recorded in 39 310 farms. However, it must be noted that the previous waves of the FSS in Austria recorded agricultural and forestry activities together. On the contrary, agricultural and forestry activities were recorded separately within the context of the FSS 2010, which led to a break in time series[1].
See detailed data at NUTS 2 level for 2000
Organic farming
Organic agriculture is an ecological production management system that promotes and enhances biodiversity, biological cycles, and soil biological activity. It is based on the minimal use of off-farm inputs and on the management practices that restore, maintain or enhance ecological harmony.
See detailed data at Nuts 2 level for 2010, 2007, 2005, 2003 and 2000
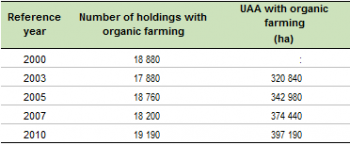
With 19 190 holdings practicing organic farming (see Table 10), Austria was among the EU Member States with the highest number of farms dedicated to this ecological production system in 2010. In relative terms, the land dedicated to organic farming covered 12 % of the Austrian agricultural land, which was one of the highest shares within the EU-27.
Data sources and availability
Methodological notes
In Austria, the first complete survey on agricultural and forestry holdings was conducted in 1902. The first Farm Structure Survey based on a random sample was carried on in 1993 and two years later the questionnaire was completely harmonised with the EU list of characteristics. Since then, Austria has conducted the FSS in compliance with the EU regulations. Statistics Austria was the responsible body for implementing the FSS 2010.
Survey on agricultural production methods (SAPM)
In 2010 a unique survey was carried out together with the Agricultural census: the Survey on agricultural productions methods (SAPM). This survey collected data at regional level needed to establish agri-environmental indicators as indicated in COM final 508/2006 and to evaluate the greening of the Common agricultural policy.
Data were collected according to specifications listed in Annex V of regulation regulation 1166/2008, namely data on tillage methods, soil conservation, landscape features, animal grazing, animal housing, manure application, manure storage and treatment facilities and irrigation.
In Austria, the SAPM was conducted as an exhaustive survey together with the Agricultural census.
Reference period
Data on the Agricultural census 2010 were collected as of the 31st of October 2010, with the exception of information on livestock which was collected as of the 1st of April 2010. Moreover, the data on land use, labour force, other gainful activities and agricultural production methods were collected with reference to the 1st of November 2009 – 31st of October 2010 timeframe. Information on the predominant type of production in horticulture and field vegetable farming as well as on flower and ornamental plants and tree nurseries was collected with reference to the 2010 calendar year.
Threshold for agricultural holdings
In Austria, both the FSS and the SAPM targeted all agricultural holdings with at least 1 hectare of agricultural area. Furthermore, farms with at least 0.15 ha of intensively utilised fruit orchards, or 0.1 hectares of land dedicated to the production of berries, strawberries, vegetables, hops, flowers or decorative plants, were also surveyed.
The thresholds set in 1995, following Austria’s accession to the EU, have been kept unchanged. Thus, they are compliant with the EU Regulation 1166/200 and allow comparison between the FSS 2010 and its previous waves.
Common land
Common land is the land that does not directly belong to any agricultural holding but on which common rights apply. It can consist of pasture, horticultural or other land. The treatment of the common land used by an agricultural holding might differ from country to country.
In Austria, common land belongs to Agrarian communities, which are associations of real estate property owners who have common rights over a piece of land. In 2010, common land was included in special agricultural holdings – this methodology was also used in the previous waves of the FSS. Generally, the agricultural area on which common rights apply consists of grassland and it is farmed by the members of the agrarian community.
Geo-reference of the holding
In Austria, information on the location of the holdings was collected by the National Statistical Institute through the use of administrative sources, i.e. the Address-Building and the Dwellings Register (ABDR). Once obtained, the coordinates were rounded to prevent the identification of single units.
Economic size
From FSS 2007 onward, the Standard output (SO), a new classification of the economic size of the holding, is used. The SO has replaced the Standard gross margin (SGM) used before. Nonetheless, for comparability reasons, both classifications are available in FSS 2007.
Context
European Commission Rural development policy aims to improve competitiveness in agriculture and forestry, the environment and the countryside, as well as to improve the quality of life in rural areas, and to encourage the diversification of rural economies.
As agriculture has been modernised and the importance of industry and services within the economy has increased, agriculture has become much less important as a source of jobs. Consequently, increasing emphasis is placed on the role farmers can play in rural development, including forestry, biodiversity and the diversification of the rural economy, in order to create alternative jobs and provide environmental protection in rural areas.
The FSS continues to adapt in order to provide timely and relevant data to help analyse and follow these developments.
Further Eurostat information
Publications
- Agriculture, fishery and forestry statistics — Main results – 2010-11 - 2012 edition
- Farm Structure Survey in Austria - 2007 - Issue number 89/2009
- Farm Structure in Austria - 2005 - Issue number 11/2007
- Structure of Agricultural Holdings - Austria 2003 - Statistics in focus 36/2005
Main tables
- Agriculture, see:
- Structure of agricultural holdings (t_ef)
Database
- Agriculture, see:
- Structure of agricultural holdings (ef)
Dedicated section
Methodology / Metadata
- Structure of agricultural holdings (ESMS metadata file - ef_esms)
- Methodological Report – FSS 2010 Austria
- Methodological Report – FSS 2007 Austria
Source data for tables and figures (MS Excel)
Other information
- Regulation 1166/2008 of 19 November 2008 on farm structure surveys and the survey on agricultural production methods and repealing Council Regulation 571/88
- Regulation 1200/2009 of 30 November 2009 implementing Regulation 1166/2008 on farm structure surveys and the survey on agricultural production methods, as regards livestock unit coefficients and definitions of the characteristics
See also
- census 2010 Agricultural census 2010
- structure All farm structure articles by country (2007)
- structure statistics Farm structure statistics
External links
Notes
- ↑ More information is available in the National Methodological Report, at page 13
