Archive:Manufacture of wood and wood products statistics - NACE Rev. 2
- Data from April 2012. Most recent data: Further Eurostat information, Main tables and Database.
This article presents an overview of statistics for wood and wood products manufacturing in the European Union (EU), as covered by NACE Rev. 2 Division 16.


(% share of sectoral total) - Source: Eurostat (sbs_na_ind_r2)


Main statistical findings
Structural profile
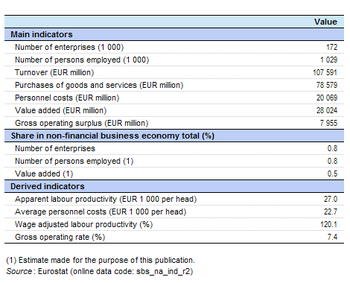
The wood and wood products manufacturing (Division 16) sector comprised 172 thousand enterprises in the EU-27 in 2009. Together they employed 1.02 million persons, equivalent to 0.8 % of the total number of persons employed in the non-financial business economy (Sections B to J and L to N and Division 95) and 3.4 % of the manufacturing (Section C) workforce. They generated EUR 28 024 million of value added which was 0.5 % of the non-financial business economy total and 2.0 % of the manufacturing total.
The apparent labour productivity of the EU-27's wood and wood products manufacturing sector in 2009 was EUR 27 thousand per person employed, below the non-financial business economy average of EUR 41.6 thousand per person employed and the manufacturing average of EUR 46 thousand per person employed. This was one of the lowest levels of apparent labour productivity among the manufacturing NACE divisions, higher only than the manufacture of wearing apparel (Division 14) and themanufacture of leather and related products (Division 15), and the same level as furniture manufacturing (Division 31).
Average personnel costs within the EU-27’s wood and wood products manufacturing sector were also relatively low, at EUR 22.7 thousand per employee compared with EUR 30.0 thousand per employee for the whole of the non-financial business economy and an average of EUR 34.5 thousand per employee for manufacturing. Again, this was amongst the lowest ratios within manufacturing (fourth lowest), and was only higher than for the manufacture of wearing apparel, leather and related products, and furniture.
The wage-adjusted labour productivity ratio combines the two previous indicators and shows the extent to which value added per person employed covers average personnel costs per employee. Due to low productivity and only slightly inferior average personnel costs the EU-27's wood and wood products manufacturing sector had a relatively low wage-adjusted labour productivity ratio in 2009, reaching 120.1 % – the non-financial business economy average was 138.8 % and the manufacturing average was 132.1 %.
The gross operating rate (the relation between the gross operating surplus and turnover) is one measure of profitability; it stood at 7.4 % for the EU-27’s wood and wood products manufacturing sector in 2009, lower than the non-financial business economy average (9.7 %) but higher than the manufacturing average (7.0 %).
Sectoral analysis
The wood and wood products manufacturing sector includes the first processing stages of sawmilling and planing of wood (Group 16.1) and the downstream activity of the manufacture of products of wood, cork, straw and plaiting materials (Group 16.2, hereafter referred to as wood products manufacturing). Within the EU-27 the largest of these two activities was wood products manufacturing, which employed just over three quarters (75.7 %) of the sectoral workforce in 2009 and generated nearly four fifths (79.0 %) of sectoral value added.
Both subsectors recorded relatively low apparent labour productivity and average personnel costs in the EU-27 in 2009, in particular the sawmilling and planing of wood. The apparent labour productivity ratio for the sawmilling and planing of wood was EUR 24 thousand per person employed and average personnel costs were EUR 18.9 thousand per employee, respectively the fifth and fourth lowest levels for these ratios among the manufacturing NACE groups for which data are available (approximately 90 groups). For wood products manufacturing these ratios were higher, EUR 28 thousand value added per person employed and EUR 24.0 thousand personnel costs per employee – nevertheless, both of these values were still well below manufacturing averages.
The particularly low average personnel costs for the EU-27’s sawmilling and planing of wood subsector helped to lift the wage-adjusted labour productivity ratio for this activity to 124.9 % in 2009, ahead of the 118.6 % recorded for wood products manufacturing; nevertheless, this ratio remained below the manufacturing average (132.1 %) for both subsectors. In contrast, the gross operating rate for these two subsectors was relatively close to the manufacturing average (7.0 %), with the 7.9 % rate for wood products manufacturing above that recorded for the sawmilling and planing of wood (6.1 %).
Country analysis
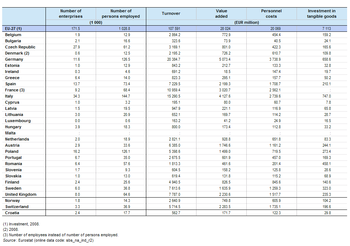
Germany recorded the highest share (18.1 %) of EU-27 value added within the wood and wood products manufacturing sector in 2009, although this share was less than the German share of EU-27 value added for the whole of the non-financial business economy (22.1 %) and was also considerably lower than the German share of EU-27 manufacturing (27.3 %). Italy (14.7 %) and France (10.8 %) were the only other Member States with double-digit shares of EU-27 sectoral value added. Nevertheless, the 6.2 % share of EU-27 value added recorded for Austria was the highest share for Austria in any of the non-financial business economy NACE divisions (with data available) in 2009; this sector was also where Estonia and Latvia recorded their highest contributions to EU-27 value added in 2009, both 0.8 %.
The German value added share was lower for the sawmilling and planing of wood subsector (16.0 %) – although it still had the largest value added of any Member State, whereas its share of the EU-27’s wood products manufacturing subsector was 18.7 %. After Germany, the largest Member States in the sawmilling and planing of wood subsector were France, Sweden and Italy, all with more than 10 % of EU-27 value added. For wood products manufacturing, alongside Germany both Italy and France also had shares of EU-27 value added in excess of 10 %; among the non-member countries this subsector was also particularly large in Switzerland, where value added was equivalent to more than 10 % of the EU-27 total.
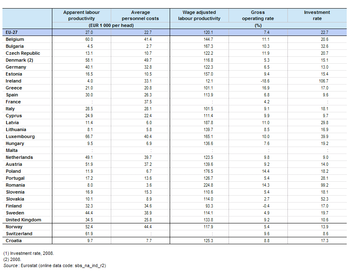
With the exception of Sweden, the Member States with the greatest value added in the wood and wood products manufacturing sector were generally not particularly specialised in value added terms. The most specialised Member States in 2009 were the Baltic Member States (in particular, Estonia and Latvia) and Austria, and to a lesser extent Sweden, Finland, the Czech Republic and Romania. The least specialised Member States in the wood and wood products manufacturing sector were Ireland, the United Kingdom, Luxembourg, the Netherlands, France, Hungary and Germany.
Several of the Member States that were relatively specialised in this sector recorded wage-adjusted labour productivity ratios that were well above the EU-27 average, for example, Estonia and Latvia were the most specialised Member States and had ratios of 157.0 % and 187.8 % respectively, while Romania had a ratio of 224.8 % which was the highest of all Member States. Only two Member States had a wage-adjusted labour productivity ratio below 100 %, which indicated that average personnel costs per employee were higher than apparent labour productivity per person employed: the relatively specialised Member State of Finland had a ratio of 93.3 %, while the least specialised Member State, Ireland, recorded a ratio of just 12.1 %.
Data sources and availability
The analysis presented in this article is based on the main dataset for structural business statistics (SBS) which are disseminated annually. The series provides information for each Member State as well as a number of non-member countries at a detailed level according to the activity classification NACE. Data are available for a wide range of variables.
Context
This article presents an overview of statistics for the wood and wood products manufacturing sector in the EU, as covered by NACE Rev. 2 Division 16. The production includes processing logs that are cut into bolts, or lumber that may then be cut further, or shaped by lathes or other shaping tools and assembled into finished products.
Classified under the sawmilling and planing of wood are the drying and machining of wood, slicing, peeling or chipping logs, the manufacture of wooden railway sleepers and unassembled wooden flooring, the impregnation or chemical treatment of wood, as well as the manufacture of wood wool, wood flour, chips or particles.
The manufacture of products of wood, cork, straw and plaiting materials includes the production of veneer sheets and wood-based panels, assembled parquet floors, other builders' carpentry and joinery (such as roof frame elements, doors, windows, shutters and their frames, stairs, railings and prefabricated buildings), wooden containers, and other wooden products such as handles, clothes hangers, household utensils and kitchenware, as well as basket-ware and the production of fire logs and pellets.
This NACE division is composed of two groups:
- the sawmilling and planing of wood (Group 16.1);
- the manufacture of products of wood, cork, straw and plaiting materials (Group 16.2).
This division does not include logging and the production of wood in the rough (which is covered by forestry and logging, part of Division 02), the manufacture of furniture whether fitted or free-standing (Division 31), the manufacture of wooden toys, brushes and brooms or coffins (part of other manufacturing, Division 32) or the installation of wooden fittings and the like (part of specialised construction activities, Division 43).
Further Eurostat information
Publications
Main tables
Database
- SBS - industry and construction (sbs_ind_co)
- Annual detailed enterprise statistics - industry and construction (sbs_na_ind)
- Annual detailed enterprise statistics for industry (NACE Rev.2 B-E) (sbs_na_ind_r2)
- Preliminary results on industry and construction, main indicators (NACE Rev.2) (sbs_na_r2preli)
- SMEs - Annual enterprise statistics broken down by size classes - industry and construction (sbs_sc_ind)
- Industry broken down by employment size classes (NACE Rev.2 B-E) (sbs_sc_ind_r2)
- Annual detailed enterprise statistics - industry and construction (sbs_na_ind)
- SBS - regional data - all activities (sbs_r)
- SBS data by NUTS 2 regions and NACE Rev.2, from 2008 onwards (sbs_r_nuts06_r2)
Dedicated section
Source data for tables, figures and maps (MS Excel)
Other information
- Regulation 58/1997 of 20 December 1996 concerning structural business statistics
- Decision 2367/2002/EC of 16 December 2002 on the Community statistical programme 2003 to 2007
- Regulation 295/2008 of 11 March 2008 concerning structural business statistics