Archive:Income poverty statistics
Favourable living conditions depend on a wide range of factors, which may be divided into two broad groups – those that are income-related and those that are not. The second group includes factors such as: quality healthcare services, education and training opportunities or good transport facilities – aspects that affect everyday lives and work. Analysis of the distribution of incomes within a country provides a picture of inequalities.
Main statistical findings
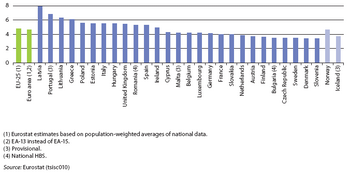
In 2006, the 20 % of the EU-25 population with the highest equivalised disposable income received almost five times as much income as the 20 % of the population with the lowest equivalised disposable income. Within the Member States, the widest inequalities were recorded in Latvia (a ratio of 7.9) and Portugal (6.8). In contrast, the narrowest income inequalities were in the Nordic Member States, Bulgaria, the Czech Republic and Slovenia, with S80/S20 income quintile share ratios of between 3.4 and 3.6.
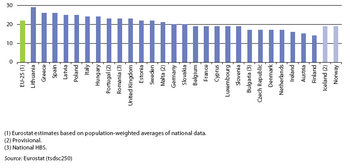
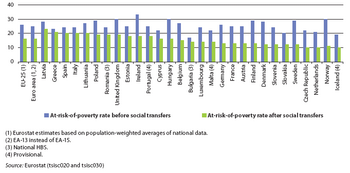
A comparison between the number of people on low incomes before social benefits other than pensions and those on low incomes after social benefits (in other words, old age pensions and survivors’ benefits are included in income both ’before’ and ’after’ social benefits), illustrates one of the main purposes of such benefits: their redistributive effect and, in particular, their ability to alleviate the risk of poverty and reduce the percentage of population having to manage with a low income. In 2006, social transfers reduced the at-risk-of-poverty rate from 26 % before transfers for the EU-25 population to 16 % after transfers in 2006; as such, social transfers lifted 38 % of those in poverty above the poverty line. Social benefits other than pensions reduced the percentage of people at-risk-of-poverty in all countries, but to very disparate degrees. The proportion of persons who were removed from being at-risk-of-poverty by social transfers was smallest in some of the Mediterranean Member States Greece, Spain, and Italy, as well as Latvia and Bulgaria. Those countries whose social protection and support systems removed the highest proportion of persons out of being threatened by poverty (over half) included Sweden, Denmark, Finland, the Czech Republic, the Netherlands, Slovenia and Germany.
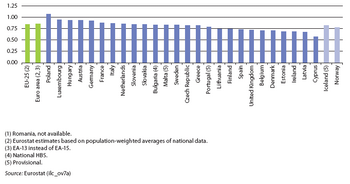
With a growing proportion of the EU’s population aged over 65 years and persistently low fertility rates (see Chapter 3 for more details), there are increasing concerns both about how Member States will be able to pay for the pension and healthcare costs linked to ageing, as well as increased poverty risks for the elderly. By comparing the relative median equivalised disposable income of persons aged above 65 to the median equivalised disposable income of persons aged below 65, the relative standard of living among the elderly can be gauged. With the exception of Poland, those aged over 65 years had an average disposable income in 2006 that was less than those aged below 65 years. In Luxembourg, Hungary, Austria and Germany, the difference in incomes between these two age groups was less than 10 %. In 2006, in the majority of Member States, the difference between the equivalised disposable incomes of those aged 65 and over and those aged between 0 and 64 was between 10°% and 30°%. However, this widened to between 30 % and 35 % in Estonia, Ireland and Latvia, while in Cyprus the median equivalised disposable income of those aged over 65 years was only 57 % of that for persons aged less than 65 years.
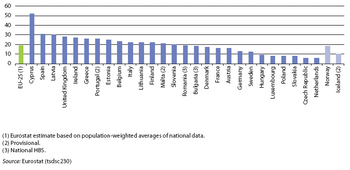
This relatively low level of income among pensioners in Cyprus was highlighted as a majority (52 %) of persons aged over 65 in Cyprus were at-risk-of-poverty in 2006. Some 31 % of persons aged over 65 in Spain and 30 % in Latvia were at-risk-of-poverty, which was in contrast to shares of less than 10 % in Hungary, Luxembourg, Poland, Slovakia, the Czech Republic and the Netherlands.
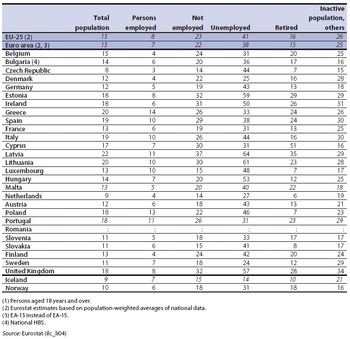
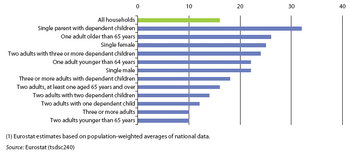
The elderly and retired were not the only group at-risk-of-poverty in 2006. Across the population of the EU-25, an estimated 15 % of persons aged 18 years or over were at-risk-of-poverty after social transfers. The most vulnerable group were the unemployed (self-assessed most frequent activity status), about two fifths (41 %) of whom were at-risk-of poverty, a share that rose to around 60 % in each of the Baltic Member States. Nearly one third (32 %) of single parent households with dependent children were at-risk-of-poverty across the EU-25 in 2006, which was the highest proportion of any type of household covered by the survey. In contrast, multi-adult households without dependent children tended to be the households with the least risk of poverty. (Please note that the at-risk-of-poverty rate emphasises a relative concept of income poverty, relative to the level of income in one country and does not take into account wealth or actual purchasing power; it also assumes that household members share their resources. Additionally, it is influenced by the equivalence scale chosen. In the future, the at-risk-of-poverty rate will be complemented by other poverty indicators.)
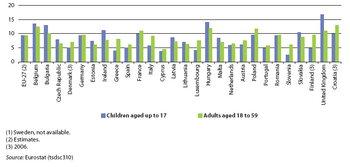
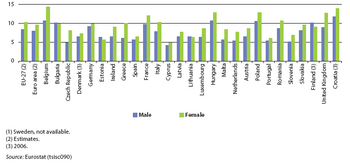
In 2007, some 9.3 % of the EU-27’s population aged between 18 and 59 years lived in a jobless household; the proportion of children (up to 17 years) living in jobless households was almost at the same level (9.4 %). The highest proportion of children living in jobless households was recorded in the United Kingdom (16.7 %), followed by Hungary (14.0 %) and Belgium (13.5 %); these two Member States also recorded the highest shares of adults aged 18 to 59 years old living in jobless households, along with Poland. Note that these statistics may be affected by a number of factors, including differences in average numbers of children and inactivity rates between different socio-economic groups.
Data sources and availability
Eurostat statistical indicators within the ILC (Income and Living Conditions) domain cover a range of topics relating to income poverty and social exclusion. One group of indicators relate to monetary poverty analysed in various ways (for example, by age, gender and activity status), across space and over time. Another set relate to non-monetary poverty and social exclusion (for example, material deprivation, social participation) across space and over time. A newly developed set of child-care arrangement indicators complements the information in this domain.
From 2005, EU-SILC covered the EU-25 Member States, as well as Norway and Iceland. Bulgaria, Romania, Turkey and Switzerland launched EU-SILC at a later date. Note that Bulgaria and Romania currently provide indicators from national Household budget surveys and that as such, these indicators are not fully harmonised.
The S80/S20 income quintile share ratio is a measure of the inequality of income distribution and is calculated as the ratio of total income received by the 20 % of the population with the highest income (the top quintile) to that received by the 20 % of the population with the lowest income (the bottom quintile); where all incomes are compiled as equivalised disposable income. Note that the final chapter at the end of this publication presents regional data for the disposable income per habitant.
The relative median income ratio is defined as the ratio of the median equivalised disposable income of persons aged above 65 to the median equivalised disposable income of persons aged below 65.
The at-risk-of-poverty rate is defined as the share of persons with an equivalised disposable income that is below the at-risk-of-poverty threshold, set at 60 % of the national median equivalised disposable income. This rate may be expressed before or after social transfers, with the difference measuring the hypothetical impact of national social transfers in reducing poverty risk. Retirement and survivor’s pensions are counted as income before transfers and not as social transfers. Various breakdowns of this indicator are calculated: by age, gender, activity status, household type, education level, etc. It should be noted that this indicator does not measure wealth but low current income (in comparison with other persons in the same country) which does not necessarily imply a low standard of living.
The relative median at-risk-of-poverty gap is calculated as the difference between the median equivalised disposable income of persons below the at-risk-of-poverty threshold and the at-risk-of-poverty threshold, expressed as a percentage of the at-risk-of-poverty threshold (cut-off point: 60 % of median equivalised income). The EU aggregate is a population weighted average of individual national figures. In line with decisions of the European Council, the at-risk-of-poverty rate is measured relative to the situation in each country rather than applying a common threshold to all countries.
The indicators related to jobless households (the share of children aged 0-17 and the share of persons aged 18-59 who are living in households where no one works) are calculated as the proportion of persons of the specified age who live in households where no one is working. Students aged 18 to 24 who live in households composed solely of students of the same age class are counted neither in the numerator nor the denominator of the ratio; the data comes from the EU Labour force survey (LFS).
Context
Favourable living conditions depend on a wide range of factors, which may be divided into two broad groups – those that are income-related and those that are not. The second group includes factors such as: quality healthcare services, education and training opportunities or good transport facilities – aspects that affect everyday lives and work. Analysis of the distribution of incomes within a country provides a picture of inequalities. On the one hand inequalities may create incentives for people to improve their situation through work, innovation or acquiring new skills, while on the other, crime, poverty and social exclusion are often seen as linked to inequalities in the distribution of incomes.
Further Eurostat information
Publications
Main tables
- Living conditions and welfare
- Income and living conditions
- Social protection
Database
- Living conditions and welfare
- Consumption expenditure of private households
- Income and living conditions
- Social protection
