Archive:Business economy - structural profile
Data from March 2011, most recent data: Further Eurostat information, Main tables and Database
Source: Eurostat (sbs_na_ind_r2), (sbs_na_con_r2), (sbs_na_dt_r2), (sbs_na_1a_se_r2)
This article focuses on the non-financial business economy and belongs to a set of statistical articles which analyse the structure and characteristics of the various economic activities within the business economy of the European Union (EU).
Main statistical findings
Source: Eurostat (sbs_na_ind_r2), (sbs_na_con_r2), (sbs_na_dt_r2), (sbs_na_1a_se_r2)

Source: Eurostat (sbs_na_ind_r2), (sbs_na_con_r2), (sbs_na_dt_r2), (sbs_na_1a_se_r2)

Source: Eurostat (sbs_na_ind_r2), (sbs_na_con_r2), (sbs_na_dt_r2), (sbs_na_1a_se_r2)
Source: Eurostat (sbs_na_ind_r2), (sbs_na_con_r2), (sbs_na_dt_r2), (sbs_na_1a_se_r2)
Source: Eurostat (sbs_sc_ind_r2), (sbs_sc_con_r2), (sbs_sc_dt_r2), (sbs_sc_1b_se_r2)

Source: Eurostat (sbs_sc_ind_r2), (sbs_sc_con_r2), (sbs_sc_dt_r2), (sbs_sc_1b_se_r2)
Source: Eurostat (sbs_sc_ind_r2), (sbs_sc_con_r2), (sbs_sc_dt_r2), (sbs_sc_1b_se_r2)
Source: Eurostat (sbs_sc_ind_r2), (sbs_sc_con_r2), (sbs_sc_dt_r2), (sbs_sc_1b_se_r2)
Size and structure of the non-financial business economy
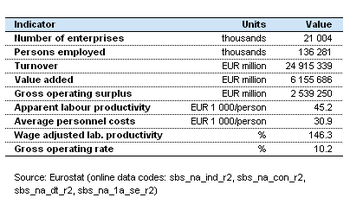
In 2008 a total of EUR 6 155 700 million of gross value added was generated in the EU-27’s non-financial business economy, which was equivalent to 63.4 % of the whole economy’s value added at factor cost. The non-financial business economy workforce reached 136.3 million persons employed, around three fifths (60.2 %) of those employed in the EU-27.
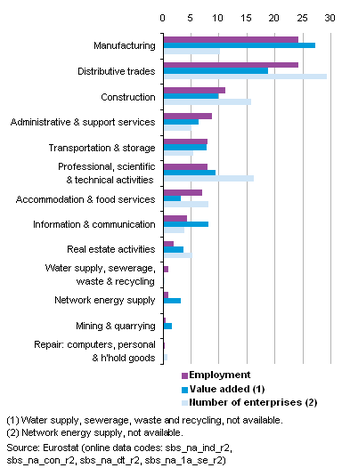
The sectors that make up the non-financial business economy are shown in Figure 1 which provides an overview of their contribution in terms of labour input (employment), output (value added), and the enterprise population. In broad terms, manufacturing and distributive trades were the largest sectors, combining for two fifths or more of each of the three indicators.
Apparent labour productivity averaged EUR 45 200 per person employed in the EU-27’s non-financial business economy in 2008, ranging from EUR 20 000 per person employed in accommodation and food services to EUR 151 000 per person employed in mining and quarrying. Average personnel costs were also lowest in the accommodation and food services sector (EUR 16 000 per employee), and joint highest in network energy supply and information and communication services (around EUR 50 000 per employee); the non-financial business economy average was EUR 31 000 per employee. It should be noted that both of these indicators are based on a simple head count of employment and so are influenced, at least in part, by the extent of part-time employment. The influence of part-time employment is largely removed by combining these two measures into the wage adjusted labour productivity ratio: for the non-financial business economy this ratio was valued at 146.3 %, indicating that average labour productivity was 46.3 % higher than average personnel costs. This indicator was below 100 % for the small sector of repair of computers, personal and household goods, and rose as high as 430 % for the mining and quarrying sector.
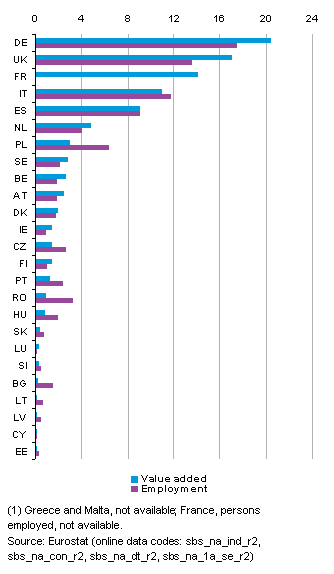
As can be seen from Figure 2 a Member State’s share of the EU-27’s non-financial business economy varies substantially depending whether it is measured in terms of value added or employment. Those with higher shares of EU-27 value added than the workforce (such as Germany and the United Kingdom) had above average apparent labour productivity.
National specialisation and concentration
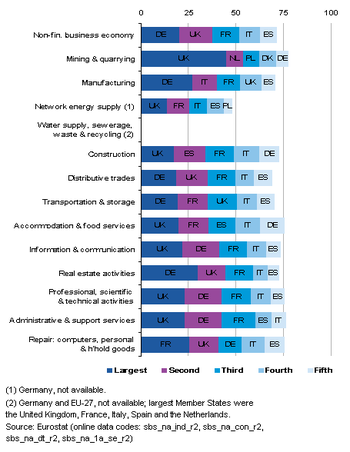
The share of the five largest Member States in the EU-27’s value added gives an impression of geographical concentration; the average share for the non-financial business economy was 71.4 % in 2008. An analysis at the level of detail shown in Figure 3 indicates that the highest concentration was for mining and quarrying and the lowest for distributive trades; network energy supply had a lower level of concentration by this measure, but it should be noted that German data is not available for this sector, thus strongly influencing the results. Generally, in each sector the five largest Member States were the five Member States with the largest overall economies, with the mining and quarrying sector the main exception.
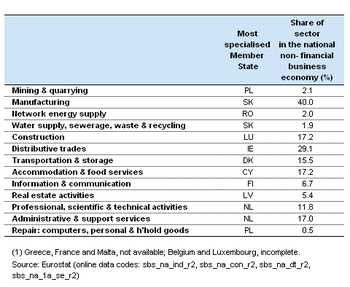
The most specialised country in an activity is the one where that activity’s share of the non-financial business economy is highest. In contrast to concentration measures that typically highlight the largest Member States, measures of specialisation often identify smaller or medium-sized Member States. In none of the activities presented in Tables 4 or 5 were large Member States the most specialised in employment terms and only in two cases (both the United Kingdom in service activities) in value added terms. Some specialisations are due to the availability of natural resources, for example mining and quarrying in Denmark and Poland.
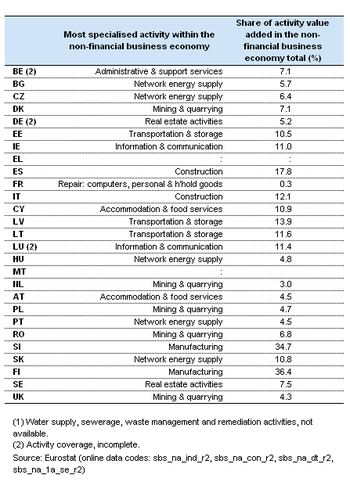
Table 6 shows the activities in which each of the Member States are the most specialised, relative to the EU-27, based on value added shares in the non-financial business economy. About half of the Member States were specialised in one of the industrial activities. Construction was the most specialised activity in Spain and Italy, transportation and storage in the Baltic Member States, accommodation and food services in Cyprus and Austria, information and communication services in Ireland and Luxembourg, and real estate activities in Germany and Sweden. Belgium was the only Member State most specialised in administrative and support services, while France was the only one most specialised in the repair of computers, personal and household goods – some activities are relatively small across the whole of the EU, which means that even in a Member State with a high specialisation relative to the EU-27 average this activity may in fact only contribute a small proportion of non-financial business economy value added, as in this case for France. It should be noted that none of the Member States were most specialised in water supply, sewerage, waste and recycling, nor in distributive trades, nor professional, scientific and technical activities.
Data sources and availability
Structural business statistics are compiled under the legal basis provided by Parliament and Council Regulation 295/2008 on structural business statistics, and in accordance with the definitions, breakdowns, deadlines for data delivery, and various quality aspects specified in the regulations implementing it.
Eurostat’s structural business statistics describe the structure, conduct and performance of economic activities, down to the most detailed activity level (several hundred sectors).
Structural business statistics now cover the ’business economy’, which includes industry, construction and many services (NACE Rev. 2 Sections B to N and Division 95); financial and insurance activities (NACE Section K) are treated separately within structural business statistics because of their specific nature and the limited availability of most types of standard business statistics in this area. As such, the term ’non-financial business economy’ is generally used in business statistics to refer to those economic activities covered by NACE Rev. 2 Sections B to J and L to N and Division 95 and the units that carry out those activities. Structural business statistics do not cover agriculture, forestry and fishing, nor public administration and (largely) non-market services, such as education or health.
Structural business statistics contain a comprehensive set of basic variables describing business demographics and employment characteristics, as well as monetary variables (mainly concerning operating income and expenditure, or investment). In addition, a set of derived indicators has been compiled: for example, ratios of monetary characteristics or per head values.
Context
In October 2010 the European Commission presented a Communication on a renewed industrial policy. ‘An industrial policy for the globalisation era’ provides a blueprint that puts industrial competitiveness and sustainability centre stage. It is a flagship initiative that forms part of the Europe 2020 strategy, and sets out a strategy that aims to boost growth and jobs by maintaining and supporting a strong, diversified and competitive industrial base in Europe offering well-paid jobs while becoming less carbon intensive. The initiative establishes a strategic agenda and proposes some broad cross-sectoral measures, as well as tailor-made actions for specific industries, mainly targeting the so-called ‘green innovation’ performance of these sectors.
The internal market remains one of the EU’s most important priorities. The central principles governing the internal market for services were set out in the EC Treaty. This guarantees EU enterprises the freedom to establish themselves in other Member States and the freedom to provide services on the territory of another EU Member State other than the one in which they are established. The objective of the Services Directive 2006/123/EC of 12 December 2006, on services in the internal market, is to eliminate obstacles to trade in services, thus allowing the development of cross-border operations. It is intended to improve competitiveness, not just of service enterprises but also of European industry as a whole. In December 2006, this Directive was adopted by the European Parliament and the Council with transposition by the Member States required by the end of 2009. It is hoped that the Directive will help achieve potential economic growth and job creation. By providing for administrative simplification, it also supports the better regulation agenda.
Further Eurostat information
Publications
Main tables
Database
- SBS - main indicators (t_sbs_na)
- SBS - industry and construction (t_sbs_ind_co)
- SBS - trade (t_sbs_dt)
- SBS - services (t_serv)
Dedicated section
Other information
- uri=CELEX:31997R0058:EN:NOT Regulation 58/1997 of 20 December 1996 concerning structural business statistics
- uri=CELEX:32002D2367:EN:NOT Decision 2367/2002/EC of 16 December 2002 on the Community statistical programme 2003 to 2007
- uri=CELEX:32008R0295:EN:NOT Regulation 295/2008 of 11 March 2008 concerning structural business statistics
Source data for tables and figures (MS Excel)
See also
- Structural business statistics - theme navigation page
- Structural business statistics introduced - background article
- All business economy articles by perspective
- Structural business statistics overview