- Data from July 2011, most recent data: Further Eurostat information, Database.
This article provides an overview of statistical data on sustainable development in the area of natural resources. They are based on the set of sustainable development indicators the European Union (EU) agreed upon for monitoring its sustainable development strategy. Together with similar indicators for other areas, they make up the report 'Sustainable development in the European Union - 2011 monitoring report of the EU sustainable development strategy', which Eurostat draws up every two years to provide an objective statistical picture of progress towards the goals and objectives set by the EU sustainable development strategy and which underpins the European Commission’s report on its implementation. More detailed information on natural resources indicators, such as indicator relevance, definitions, methodological notes, background and potential linkages, can be found in the publication mentioned above, p. 281-305.
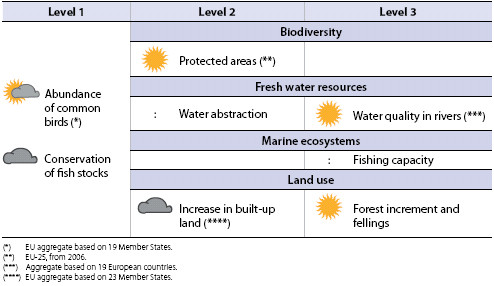
The table below summarises the state of affairs of in the area of natural resources. Quantitative rules applied consistently across indicators, and visualised through weather symbols, provide a relative assessment of whether Europe is moving in the right direction, and at a sufficient pace, given the objectives and targets defined in the strategy.
Overview of main changes
Changes in the natural resources theme since 2000 show both favourable and unfavourable trends. On the one hand, there has been continued progress in the designation of protected areas and in water quality, and the harvesting of wood from forests remains sustainable. The abundance and diversity of common birds have stabilised, albeit in a substantially poorer state than they were in 1990 and previous decades. On the other hand, marine fish stocks remain under threat and built-up land continues to increase at the expense of areas of seminatural land.
Main statistical findings
Headline indicators
Abundance of common birds
The EU index for all common birds has stabilised between 2000 and 2008, after experiencing sharp decreases between 1990 and 2000
- A stabilisation in common bird population has begun
The common bird index combines information on the diversity and abundance of common bird species. Apart from human impacts on habitats, bird populations fluctuate from year to year due to complex interactions with other species and environmental factors such as food supply and climatic conditions. Consequently trends can only be derived from observations over a long period of time.
Between 1990 and 2000 the index of all common birds for 19 Member States showed a steep decline of 1.3 % per year on average. Since 2000 there have been signs of recovery. Observed common bird population diversity and abundance during that period has been growing with an average of 0.5 % yearly. Among the species that have shown some increase, habitat generalists are well represented. Species that have increasing trends also include some specialist forest species (such as the Blackcap), the Eurasian Collared Dove, the Common Buzzard and the Common Raven; both Buzzard and Raven are recovering from past declines [1].

- But abundance of common farmland birds is still declining
In contrast, the population of farmland birds, which is a subcategory of common birds, has continued to decline, albeit at a lower rate in recent years. Between 1990 and 2000, the farmland bird index fell by 1.4 % per year on average. Since then the annual rate of decline has fallen to about 0.7 %. The population of farmland birds in the Member States that were part of the 2004 and 2007 EU enlargements which were previously performing better are now, increasingly, catching up with the declining trends of the rest of the EU. Intensification of agricultural practices and the ensuing deterioration and conversion of suitable habitats appear to be among the main drivers behind these trends [2].
A decline in the common farmland bird index took place in many of the 20 Member States for which information is available. Bulgaria, Slovakia and Germany show the highest annual average rates of decline, whilst Portugal, Latvia and Finland show the most positive trends.

Conservation of fish stocks
Between 2000 and 2006 the proportion of total fish catches taken from stocks outside safe biological limits more than doubled, rising from 10% to 21%
Fish stocks continue to be threatened by overfishing

Despite temporary improvements in 2002 and 2005, 21 % of total fish catches in 2006 were from stocks outside safe biological limits, and catches of all categories of fish considerably exceeded sustainable levels of exploitation.
Prior to 2000, the proportion of total catch from stocks outside safe biological limits in EU-managed waters of the North-East Atlantic fluctuated at around 10 %. Large deviations from this level occurred in 2001 and 2003, driven by changes in the status of certain species whose catches were very high and, therefore, had a strong influence in the overall figures. These species were blue whiting (pelagic – open ocean stock) in 2001 as well as mackerel (pelagic) and sandeel (industrial stock) in 2003. Total catches taken from stocks outside safe biological limits moved closer to the previous 10 % level in 2005. However, due to a sharp increase in unsustainable catches, especially of pelagic and industrial fish, and the constant high value for demersal and benthic fish (living on or close to the sea bed), total fish catches from stocks outside safe biological limits again exceeded the 20 % mark in 2006. Fish stocks remain threatened by overfishing.
Biodiversity
Protected areas
Between 2003 and 2007 the area designated for nature conservation in the EU-15 grew steadily, reaching a level of 96% of that considered sufficient

Four Member States have already achieved 100 % sufficiency and ten others are over 90% sufficient
The establishment of Natura 2000 sites is an important pillar of the EU’s efforts to halt the loss of biodiversity. The sufficiency of designated areas in the EU-15 rose steadily from 83 % in 2003 to 96 % in 2007. For EU-25, the sufficiency of designated areas rose from 82 % to 84 % between 2006 and 2007.
Although data for the EU as a whole are currently only available up to 2007, 2008 data are available for individual Member States. Whilst Belgium, Denmark, Italy and the Netherlands had already achieved 100 % sufficiency by 2008 and a further ten Member States were over 90 % sufficient, Cyprus and Poland remained with 25 % and 17 % respectively. The largest increases from 2003 to 2008 have been in Germany (from 27 % to 99 %) and Sweden (from 74 % to 99 %).
Deadwood on forest land
The available data on deadwood show that although, there have been slight improvements between 2000 and 2005, the overall amounts of deadwood are low and may not be sufficient to preserve biodiversity in forests. The indicator has not been evaluated because deadwood can also be undesirable, providing a habitat for insect pests and posing a fire risk in dry regions
Amounts of deadwood are generally insufficient to support forest biodiversity
Deadwood on forest land varied between 4 and 23 m3/ha in 2005. In most countries for which data are available, deadwood on forest land either increased or remained stable between 2000 and 2005, except for the Czech Republic where deadwood decreased from about 21 to 12 m3/ha. Austria and Lithuania were the Member States with the highest levels of deadwood in 2005.
In general forests in the more easterly countries and in mountainous regions have the highest volumes of deadwood [3].
Freshwater resources
Water abstraction
In nearly all Member States for which data are available, water abstraction remained at a sustainable level, and most countries appear to have reduced pressures on water resources by reducing their abstraction rates between 1990 and 2007
Abstraction levels are generally within sustainable limits


The share of total annual water abstraction from available renewable water resources gives an indication of the pressure on the long-term annual average of renewable water resources. The consumption of both surface and groundwater is driven by four main economic activities, whose relative importance varies across Member States:
- cooling in electricity production;
- public water supply;
- the manufacturing industry;
- agriculture, forestry and fishing.
Overall, 44 % of the total abstracted water is for energy production, 24 % for agriculture, 21 % for public water supply and 11 % for industry. These figures vary significantly across the EU, and in southern counties agricultural water abstraction accounts for 60 % of the total [4].
From 1990 to 2000, annual surface water abstraction either decreased or remained relatively stable in most Member States. This trend continued from 2000 to 2007, during which only Cyprus experienced a significant increase in surface water abstraction, reaching 38 % of renewable resources in 2004, which, however, levelled off to about 29 % in 2007. Romania, which at about 44 % had by far the highest level of abstraction in 1990, reduced its abstraction to 21 % in 2000 and to 16 % in 2007.
Groundwater abstraction either decreased or remained relatively stable between 1990 and 2007 and reached sustainable levels in 2007 in all Member States for which data are available. Several countries showed high or, in the case of Denmark and Cyprus, unsustainable groundwater abstraction levels during the 1990s. Denmark reduced its abstraction level from about 126 % in 1990 to a sustainable abstraction rate of about 66 % in 2004. Groundwater abstraction in Cyprus peaked at 122 % in 1999, but this had come down to 82 % by 2007.
Water quality in rivers
Between 2000 and 2006 the annual mean concentration of biochemical oxygen demand has decreased in rivers for the 18 countries considered, indicating a favourable increase in water quality
Water quality in rivers has improved

Biochemical oxygen demand (BOD) estimates the total amount of biodegradable organic matter in a system and is a commonly used indicator of water quality: the lower the BOD, the higher the water quality. There has been a favourable decrease in BOD in the 18 Member States over the entire period for which data are available, falling from a mean level of 5.0 mg/l in 1992, to 3.2 mg/l in 2000, and continuing to 2.3 mg/l in 2006. This trend is indicative of the improvement in waste water treatment following the 1991 Urban Wastewater Directive and possibly to decreasing emissions from agriculture.
The trends in BOD are mirrored by other, more specific, measurements of water quality, such as ammonium, nitrate and phosphate.
Marine ecosystems
Fishing capacity
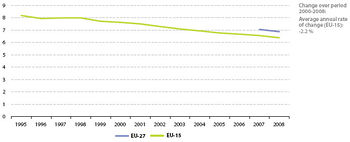
Despite the continuous decrease in fishing fleets, as measured by the total engine power of fishing vessels, progress in fishing efficiency means that fishing capacity is still too high for the available fish stocks. However, since no direct measure of fishing capacity is available, this indicator cannot be evaluated
Whilst the size of fishing fleets has declined, fishing capacity is still too high to sustain stocks

The EU-15 fishing fleet, as measured by the total engine power of fishing vessels, decreased by 1.4 % on average per year from 1995 to 2000. From 2000 to 2008 the average annual rate of decrease reached 2.4 %. The trend towards reducing fishing fleets can be observed in all Member States and the limited data available for the EU-27 fishing fleet show a similar but somewhat steeper trend. According to the Green Paper on the Reform of the Common Fisheries Policy, these decreases may well have been offset by technological progress which is estimated to increase fishing efficiency by approximately 2-3 % per year [5]. The imbalance between the fleet and available fish stocks has therefore not been redressed, resulting in reduced landings and a heavier reliance of the EU market on imports.
Land use
Change in land cover
During the period from 1990 to 2000 artificial surfaces as a whole grew by approximately 5.4 %. The main increases were in the urban fabric and industrial, commercial and transport units. While the latter is growing the fastest, urban fabric poses the main pressure in terms of hectares of sealed surface
Artificial surfaces are increasing at the expense of semi-natural and agricultural land
Built-up land is continuously encroaching on farmland and semi-natural land. The category ‘industrial, commercial and transport units’ (comprising industrial sites, airports, ports and roads) experienced the highest rate of growth. It is particularly significant that within this category, road and rail networks showed an especially high growth rate, as the fragmentation of habitats associated with such extensive linear structures is a major pressure on biodiversity, limiting the range available to animals for breeding or finding food. Although growing more slowly, the largest change in absolute terms was due to increases in the ‘urban fabric’ (comprising housing estates and other urban construction).
Forest trees damaged by defoliation


The share of forest trees damaged by defoliation increased moderately between 2000 and 2006. The objective of improving the prevention of forest degradation has therefore not been achieved
Defoliation in the EU-27 remains at the warning stage level
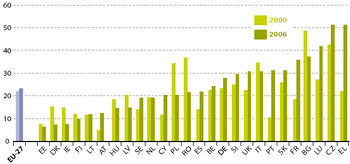
In the mid-1990s about 26 % of forest trees in the EU-27 showed damage by defoliation. By 2000 this had fallen to about 22 %, but rose again in 2002 and 2003. Although the amount of defoliation has been decreasing since 2004, in 2006 the extent of defoliation stood at 23 %, one percentage point higher than in 2000.
Although a variety of factors influence defoliation, air pollution and the extreme heat and drought in large parts of Europe during the summer of 2003 contributed to the higher defoliation in that year as well as in the following year [6].
No clear pattern across Member States
In 2006, the high variance in values between Member States indicated no clear pattern within the EU. The highest defoliation rates were found in the Czech Republic and Luxembourg, where over 40 % of the trees assessed were damaged. The rate of defoliation was less than 10 % in Estonia, Denmark, Ireland and Finland.
Further Eurostat information
Publications
Database
- Indicators
- Natural Resources
Dedicated section
Other information
- Progress towards the European 2010 biodiversity target, European Environment Agency, EEA Report No 4/2009
- Progress towards the European 2010 biodiversity target - Indicator fact sheets, European Environment Agency, EEA Technical Report No 5/2009
- State of Europe's forests 2007: The MCPFE report on sustainable forest management in Europe, MCPFE Liaison Unit Warsaw, UNECE and FAO, Ministerial Conference on the Protection of Forests in Europe, 2007
- Sustainable use and management of natural resources, European Environment Agency, EEA Report No 9/2005, Publications Office of the European Union, Luxembourg, 2005
- The European environment - State and outlook 2005, European Environment Agency
- Thematic strategy on the sustainable use of natural resources, Commission communication COM(2005) 670
- Worm, B. and Hilborn, R., Rebuilding global fisheries, Science, 2009, vol. 325, pp. 578-85
External links
See also
- Agri-environmental statistics
- All articles on sustainable development indicators
- Biodiversity statistics
- Environmental Data Centre on Natural Resources and Products
- Water statistics
Notes
- Pan-European Common Bird Monitoring Scheme The state of Europe’s common birds 2007, CSO/RSPB, Prague, 2007 ↑
- BirdLife International Europe-wide monitoring schemes highlight declines in widespread farmland birds, 2011 ↑
- Dudley, N., Equilibrium, Vallauri, D., and WWF France, Deadwood - living forests, WWF Report - October 2004, WWF-World Wide Fund For Nature, Gland, Switzerland, 2004 ↑
- European Environment Agency, Water resources across Europe – confronting water scarcity and drought, EEA Report No 2/2009, Publications Office of the European Union, Luxembourg, 2009 ↑
- Banks, R., Cunningham, S., Davidse, W.P., Lindebo, E., Reed, A., Sourisseau, E. and De Wilde, J.W., The impact of technological progress on fishing effort ↑
- MCPFE Liaison Unit Warsaw, UNECE and FAO, State of Europe’s forests 2007: The MCPFE report on sustainable forest management in Europe. Ministerial Conference on the Protection of Forests in Europe, 2007, p. 24. ↑


