Archive:Sustainable development - public health
- Data from July 2011, most recent data: Further Eurostat information, Database.
This article provides an overview of statistical data on sustainable development in the area of public health. They are based on the set of sustainable development indicators the European Union (EU) agreed upon for monitoring its sustainable development strategy. Together with similar indicators for other areas, they make up the report 'Sustainable development in the European Union - 2011 monitoring report of the EU sustainable development strategy', which Eurostat draws up every two years to provide an objective statistical picture of progress towards the goals and objectives set by the EU sustainable development strategy and which underpins the European Commission’s report on its implementation. More detailed information on public health indicators, such as indicator relevance, definitions, methodological notes, background and potential linkages, can be found on page 191-213 of abovementioned publication.
The table below summarises the state of affairs of in the area of public health. Quantitative rules applied consistently across indicators, and visualised through weather symbols, provide a relative assessment of whether Europe is moving in the right direction, and at a sufficient pace, given the objectives and targets defined in the strategy.
Overview of main changes
The developments in the public health theme since 2000 present a generally favourable picture. The headline indicator shows that in general people are living longer. Improvements are visible in the reduction of deaths due to chronic diseases, suicides, the production of toxic chemicals, annoyance by noise, and serious accidents at work. On the other hand, not all have benefitted from the improvements and there are still important inequalities in health and access to healthcare. Furthermore there remain challenges related to the environmental determinants of health. Since 2000, people in the EU have been more exposed to ozone as well as to particulate matter.
Main statistical findings
Headline indicator
Life expectancy and healthy life years
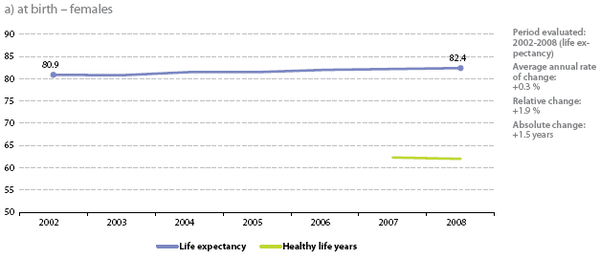
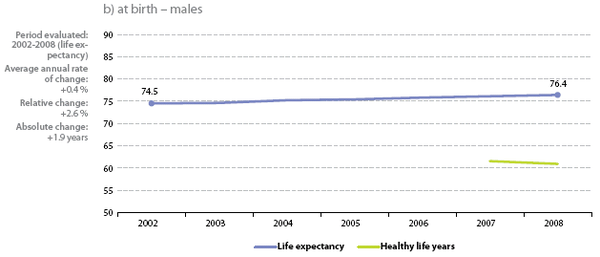
Between 2002 and 2008 life expectancy at birth of women and men in the EU rose moderately. The faster growth rate for men indicates a closing of the gap in life expectancy between women and men
- Life expectancy at birth is six years higher for women than men, but the gap is closing'
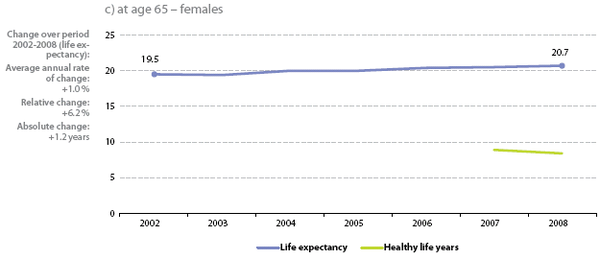
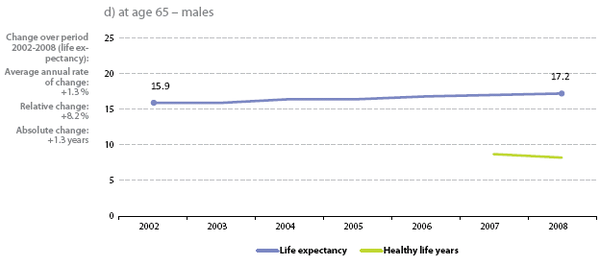
Average life expectancy at birth in the EU is some six years higher for women than men. A girl born in 2008 is expected to live 82.4 years on average; a boy 76.4 years. For 65-year-olds, in 2008 there was an expectation of a further 20.7 years for women and 17.2 years for men.
- Healthy life expectancy is generally stable'
Over the period from 2002 to 2008 life expectancies at birth in the EU grew at an annual average rate of 0.3 % for women and 0.4 % for men (respectively 3 and 4 months per year). The growth rates at age 65 were somewhat higher, representing 1.1 % on average for women and 1.3 % for men. The different growth rates for women and men mean that the gap between the two sexes has narrowed.
Due to the lack of sufficiently robust figures for healthy life years it is only possible to draw the overall conclusion that for the EU as a whole the situation is stable.
- Source: Eurostat online data codes
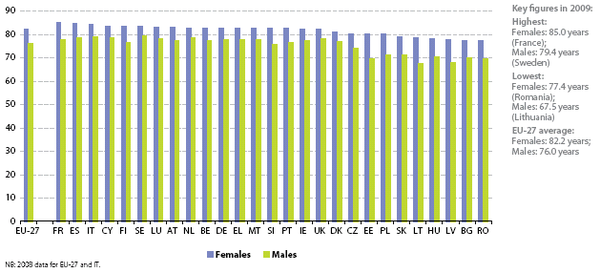
- Life expectancy is lowest in most Central and Eastern European Member States
Growing life expectancy reflects improved living conditions in the EU in terms of economic welfare, social security and health care resources. Nevertheless, there are differences between Member States. Some of the Central and Eastern European Member States tend to have shorter life expectancies mostly due to poorer socio-economic conditions in these countries, especially higher unemployment rates.
Health and health inequalities
Deaths due to chronic diseases
Between 2000 and 2008 deaths due to chronic diseases fell considerably for under 65s in the EU
- Deaths due to lifestyle-inflicted chronic diseases have been decreasing steadily for many years
The majority of the population in high- and middle-income countries dies from chronic diseases. In the population aged under 65 years, deaths due to chronic diseases can be considered as premature and occur much less frequently than in the older population even if they account for nearly 60 % of all causes of death Cite error: Closing </ref> missing for <ref> tag.
Urban exposure to particulates varies from country to country. Apart from sporadic wildfires, the Member States bordering the Mediterranean also suffer from dust blown from North Africa.
Exposure to air pollution by ozone
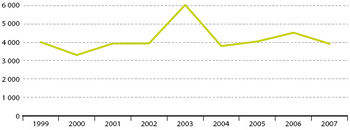
Exposure to ozone has increased in the EU-27 between 2000 and 2007 by 2.5 % per year on average, with considerable variation from one year to the next
Exposure to ozone has risen, with a peak in 2003
Although exposure to ozone varies considerably from year to year, overall it has risen at an annual average rate of 2.5 % since the year 2000. The high exposure in the year 2003 is related to the heat wave in that summer [1]. A lesser peak also occurred in 2006 for similar reasons.
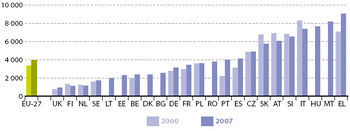
Urban exposure to ozone widely varied between countries, partly due to differences in climate and vegetation. In general, southern countries, with higher summer temperatures, such as Greece and Malta show higher exposure levels than the cooler northern countries such as the UK, Finland and the Netherlands. Nevertheless, peaks occurred throughout the EU in 2003 and 2006 due to exceptionally high temperatures in those years. This increase was most pronounced in the northern countries, which showed higher relative increases compared to the southern countries.
Annoyance by noise
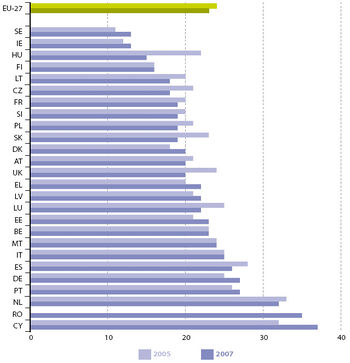
Over the short period from 2005 to 2007, the share of people in the EU-27 feeling annoyed by noise declined significantly
The share of population annoyed by noise has been favourably declining, particularly in some eastern Member States
Between 2005 and 2007, the percentage of the population who declared that they suffer from noise declined by 2.1 % per year on average. Possible explanations for this decline are closedowns of heavy industry, quieter cars resulting from EU legislation (11) , and the replacement of tramways by subways and buses. Although these most recent data cannot be compared directly to the earlier time-series for EU-15, this earlier series is indicative of a longer term trend in the reduction of noise annoyance.
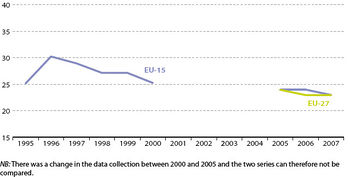
The country split shows that large reductions in noise annoyance have occurred in Hungary, the Czech Republic and Slovakia, and to a lesser extent in Lithuania, the UK and Luxembourg. On the other hand, in Cyprus, where the degree of annoyance was already high, Estonia, Germany, Greece and Sweden the situation worsened between 2005 and 2007.
Serious accidents at work
With the substantial decrease in serious accidents at work since 2000 across the EU-27 countries, the indicator presents a favourable development
Serious accidents at work are still at a high level but on track to meet the target for 2012
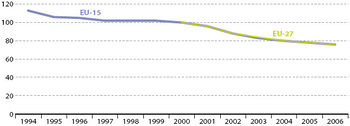
The incidence of serious accidents at work decreased in the EU-27 by 4.5 % per year on average between 2000 and 2006. This rate of decrease is close to the 5 % per year which will be needed in order to meet the target of an overall reduction of 25 % over the period 2007 to 2012.
This decline should be seen in light of the decline in heavy industry in the EU and the increasing use of automation. Despite this strong downward trend, serious accidents at work remain at a high level: in 2005 there were nearly 4 million serious accidents at work.
Further Eurostat information
Publications
- Health statistics - Atlas on mortality in the European Union Luxembourg, 2009
- Perception of health and access to health care in the EU-25 in 2007
- Sustainable development in the European Union - 2009 monitoring report of the EU sustainable development strategy
Database
- Indicators
- Public Health
Dedicated section
Other information
- Closing the gap in a generation: health equity through action on the social determinants of health, World Health Organization, Commission on Social Determinants of Health
- Major and chronic diseases - Report 2007 European Commission
- White paper - together for health: a strategic approach for the eU 2008-2013, European Commission
External links
See also
Notes
- ↑ Johnson H., Kovats S., McGregor, G., Stedman, J., Gibbs, M., and Walton, H., ‘The impact of the 2003 heatwave on daily mortality in England and Wales and the use of rapid weekly mortality estimates’, Euro Surveillance, 2005, Vol. 10, pp. 168-171.


