Archive:Nitrogen balance in agriculture
- Data from September 2011, most recent data: Gross Nutrient Balance
The Gross Nitrogen Balance provides an insight into the links between agricultural Nitrogen (N) use, losses of N to the environment, and the sustainable use of soil N resources. A persistent surplus of nitrogen indicates potential environmental problems, such as ammonia emissions (contributing to acidification, eutrophication and atmospheric particulate pollution), nitrogen leaching (resulting in pollution of drinking water and eutrophication of surface waters) or emissions of nitrous oxides (a potent greenhouse gas). A persistent deficit indicates the risk of decline in soil fertility. The Gross Nitrogen Balance show the link between agricultural activities and the environmental impact, identifying the factors determining nitrogen surpluses or deficits and the trends over time. The Gross Nitrogen Balance can only indicate the potential risk to the environment as the actual risk depends on many factors including climate conditions, soil type and soil characteristics, management practices such as drainage, tillage, irrigation etc.
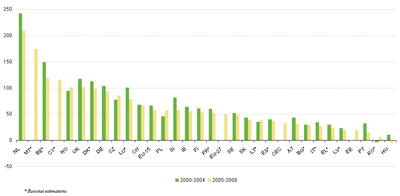
Between 2005 and 2008, the Gross Nitrogen Balance for the EU-27 remained relatively stable, with an estimated average of 50 kilograms of N per hectare of agricultural area. In the EU-15 the Gross Nitrogen Balance fell from an estimated average of 66 kg/ha over the period 2000-2004 to an estimated average of 58 kg/ha over the period 2005-2008. In the ten former Central and Eastern European (CEC) CountriesPoland, Slovenia, Slovakia, Estonia, Lithuania, Latvia, Czech Republic, Hungary, Romania and Bulgaria. the GNB was much lower than in the EU-15, with an estimated average of 33 kg/ha over the period 2005-2008.
The Nitrogen Surplus is highest in countries in the North-West of Europe (BE, NL, NO, UK, DE, DK) and the Mediterranean islands MT and CY, while the Mediterranean countries (PT, IT, ES, EL) and many of the former CEC countries belong to the countries with the lowest Nitrogen surpluses. Figure 1 shows the average Gross Nitrogen Balance per hectare of agricultural land (the total of arable land, land under permanent crops and permanent grassland) for the periods 2000-2004 and 2005-2008. Most countries reduced the Gross Nitrogen Balance per ha in the second half of the first decade of the 21st Century as opposed to the first half. Exceptions were CZ, PL, RO and NO. The average Gross Nitrogen Balance could not be estimated for the period 2000-2004 for CY, MT and EE due to missing data.
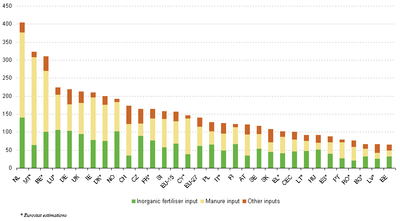
Many of the countries with a high average Nitrogen surplus between 2005 and 2008 also have a relative high Nitrogen input per ha (for instance NL, MT, BE), see Figure 2. A high input does however not necessarily lead to a high Nitrogen balance, as the balance is also determined by the output. The Nitrogen input per ha of IE (estimated at 210 kg N per ha) for instance is comparable to that of the UK (estimated at 212 kg N per ha), but the N surplus of IE is 45% lower, as the Nitrogen output per ha in IE was estimated on average 155 kg N per ha and the output in the UK only 111 kg N per ha.
Inorganic fertilisers and manure account for more than 80% of the Nitrogen input in the EU27 between 2005 and 2008, see
Figure 3. The recovery of Nitrogen through the use of compost, sewage sludge, industrial waste etc is insignificant at the moment. Data on other organic fertilisers are however lacking in many countries, the significance of these fertilisers could therefore be underestimated. The fixation of Nitrogen by leguminous crops and free living organisms contributes on average 7% to total Nitrogen input in the EU-27. The biological nitrogen fixation in grasslands mixed with leguminous crops is however not included in the estimations, the significance of biological fixation might therefore be underestimated. The level of atmospheric deposition is depending on NH3 emissions (of which agriculture is the main source) and nitrogen oxides emissions (where the contribution of agriculture is negliglible) and climate conditions (transport through air to other regions). Atmospheric deposition contributed on average to 9% of total inputs in the EU27.
The choice of fertilizer type (manure, mineral fertilizers, other organic fertilizers) has different impacts on the environment:
- Nitrogen volatilizes from manure in animal housing, storage and with the application to the land. These emissions mainly depend on the type of manure, farm management practices like type of animal housing, manure storage, timing and application techniques.
- N emissions from mineral fertilizers during the application to the land depend on type of fertilizer, farm management practices like application techniques, timing and other factors such as soil type, and weather conditions.
- The N is not available to the plant in the same rate for different types of manure and mineral fertilizers.
- Other potential fertilisers like urban wastes often include health hazards (to both plants and humans) and procedures commonly used to reduce these hazards - such as composting - tend to reduce the fertilizer value (leaching/volatilisation).
- Nitrogenous fertilisers are produced using gas, the production of N fertilisers contributes therefore to GHG emissions and fossil fuel depletion.
The share of manure in total inputs was on average for 2005-2008 smaller in the former CEC countries (32%) than in the EU15 (40%). Manure withdrawals and imports are significant only in a very few countries (BE, NL, HU). This means that for most countries the manure input is mainly determined by the amount of manure produced in the country. The manure production in kg N per ha was almost twice as high on average in the EU15 as in the former CEC countries in the period 2005-2008. The manure nitrogen production is determined by the amount and the type of livestock in the country. Figure 4 in Agri-environmental statistics shows the livestock density in the EU in 2007. MT, NL, BE, DK, CY and IE have the highest livestock densities and also have the highest rates of manure input per ha (>=100 kg N per ha). RO, BG, LT, SK, EE and LV
have the lowest livestock densities and also belong to the countries with the lowest rates of manure input per ha (<40 kg N per ha). The countries with the highest livestock densities also belong to the countries with a high share (>=50%) of manure in total input. PT and RO, two countries with a relative low livestock density have a relative high share of manure in total input as well, due to a low use of fertilizers.
Figure 2 shows that some of the countries (NL, BE) with the highest use of manure per ha also have a high use of mineral fertilizers (>100 kg N per ha), while some of the countries (RO, ES, LT, SK, BG, LV, EE) with the lowest rates of manure per ha (<40 kg N per ha) also belong to the countries with a relative low use (<50 kg N per ha) of min
eral fertilizers per ha.
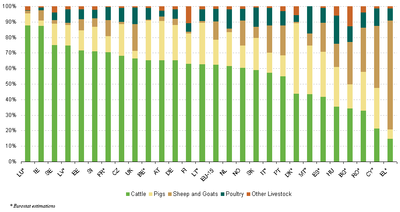
Figure 4 shows that cattle is the main source of manure production and more than 50% in all countries except in DK (where pigs have the highest share), in MT, ES, HU, BG, RO (where different livestock types are important), and in CY and GR (where sheep and goats have the highest share).
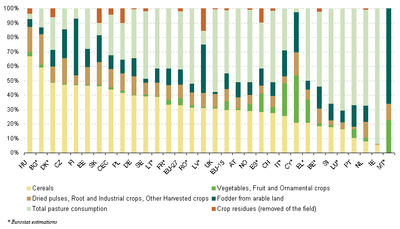
The removal of N with harvest and grazing of crops and forage per ha varies between crops and countries as can be seen in Figure 5. Per ha, grassland and cereals production have the highest N removal rates, though great variation exists between countries due to differences in yields and N content per tonne of product. The N content per tonne product is among others depending on farmer practices like fertilisation, irrigation, mowing vs grazing etc.
The dominant share of total N output in the EU27 (2005-2008) is the uptake of N with cereal production (ca 1/3) and grassland (40%), see Figure 6. N output is depending on cropping patterns, yields, farm management practices (tillage, irrigation etc), climate etc. Figure 1 in Agri-environmental statistics shows the cropping pattern in 2007, when permanent and temporary grassland covered 39% of the UAA in 2007 (38% in 2005) and cereals 34% (same as 2005). There are however significant differences between countries, in some countries (for example UK, SI, IE, NO) grassland dominates the UAA, where for instance in BG, HU and DK cereals are the dominating crop. Permanent crops are significant in Mediterranean countries.
Data sources and availability
The methodology of the nitrogen balances is described in. The Gross Nitrogen Surplus is calculated from the total inputs minus the total outputs. The Gross Nitrogen Surplus per ha is derived by dividing the total Gross Nitrogen Surplus by the reference area. The reference area of the current version of balances uploaded in Eurobase is the sum of Arable Land (L0001), Permanent Grassland (L0002) and Land under Permanent Crops (Data on these areas can be found in Eurobase (apro_cpp_luse))
The inputs of the Nitrogen Balance are:
Fertilisers:
- Inorganic Fertilisers.
- Other organic Fertilisers (not including manure).
Gross Manure Input:
- Manure production (represents the N at the time of excretion, id est no reductions are made for N
losses due to volatilisation in stables, storages and with the application to the land).
- Manure withdrawals: Manure export, Manure processed as industrial waste, Non-agricultural use of
manure, other withdrawals.
- Change in Manure Stocks.
- Manure import.
Other Nitrogen Inputs:
- Seeds and Planting Material.
- Biological Fixation by Leguminous crops and free living organisms.
- Atmospheric deposition.
The Outputs of the Gross Nitrogen Balance are:
Total removal of Nitrogen with the harvest of crops (Cereals, dried Pulses, Root crops, Industrial crops, Vegetables, Fruit, Ornamental plants, Other harvested crops).
Total removal of Nitrogen with the harvest and grazing of Fodder (Fodder from arable land, Permanent and Temporary Pasture consumption).
Crop residuals removed from the field.
The N input and N output is estimated for each item of the balance from basic data by multiplying with coefficients to convert the data into N content. Basic data are mostly derived from agricultural statistics. Coefficients are mainly estimated by research institutes and can be based on models, statistical data, measured data as well as expert judgements. A more detailed description of the data used and coefficients can be found in the metadata.
Due to methodological issues or missing data, Eurostat has estimated the Gross Nitrogen Balances for Malta, Belgium, Denmark, Cyprus, Italy, Spain, Luxembourg, France, Lithuania, Latvia, Bulgaria, Romania and Greece.
Meteorological conditions have a big impact on the annual estimated Gross Nitrogen and Gross Phosphorus Balances. The amount of nutrients removed with the harvest and grazing of crops and fodder, is depening on the nutrient content of crops and fodder and the yields of crops and fodder. The nutrient content of fodder and crops is estimated to be more or less constant in most countries. The amount of nutrients removed with the harvest and grazing of crops and fodder is therefore mainly depening on yields. Yields are depending on farmer practices (like pesticide and fertiliser use, irrigation etc) and on meteorological conditions. Metereological conditions vary significantly from year to year and these fluctuations can also be seen in the estimated nutrient output and surplus. In 2003 and 2007 for instance, large parts of Europe were hit by extreme weather causing significant drops in crop production, in many Member States a peak in the balance can be noted for these years. Variations in the nutrient surplus between years should therefore be interpreted with care. To limit the impact of metereological conditions on the trend, it is best to analyse the trend over averages of a few years.
Context
The Gross Nitrogen Balance indicates the total potential risk to the environment (air, water and soil). The output side of the balance presents the nutrient uptake by harvested (and grazed) crops and fodder and crop residues removed from the field; id est the agricultural production from the soil. The input side of the balance counts all N supplied to the soil. Sustainability could be defined by preserving and/or improving the level of production without degrading the natural resources. The harvest and grazing of crops and fodder means that N is removed from the soil. To sustain soil fertility this removal of N in principal should be compensated by supplying the same amount of N. Fertilisers and manure are therefore necessary to supply the crops with the necessary N for growing. There are certain complications however; not all of N in fertilisers and manure reaches the plant, a part of the N in fertilisers and manure is lost due to volatilisation in animal housing, storage and with the application to the land, organic N in manure first needs to be mineralized before it is available to the plant which means that part of the N does not become available to the plant in the year it is applied, yield and therefore the uptake of N by crops is not only determined by inputs but also by uncontrollable factors like weather. Furthermore, the risk of N leaching and run-off does not only depend on the excess N but also on the type of soil, precipitation rates, soil saturation, temperature etc. Abating measures to reduce N emissions directly impact the amount of N in manure and fertilisers applied to the soil. A higher emission rate means lower N content of manure/fertilisers applied to the soil, but means a higher contribution to environmental problems related to GHG and NH3 emissions. Lowering the emission rate means increasing the rate of N in manure/fertilisers, and therefore increasing the potential risk of leaching and run-off.
The estimated N surplus on its own therefore does not tell so much on the actual risks to the air, water and soil. The actual risk depends on many factors including climate conditions, soil type and soil characteristics, soil saturation, management practices such as drainage, tillage, irrigation etc. The actual risks to the environment are better represented by the agri-environmental indicators 18 Ammonia emissions, 19 GHG emissions, 27.1 Water quality (Nitrate pollution). These indicators however do not present a link between the agricultural activities and the environmental impact. The Nitrogen Balance presents a link between agricultural activities and the environmental impact. What factors determine the N surplus and how do they change over time.
The Gross Nitrogen Balance relates to several policies such as:
RDP – Rural Development Programme: Various agri-environment measures tackle the problem of excess nutrients through reduced fertiliser use. Nitrogen balances are required for the Rural Development Programme 2007-2013 (Council Regulation No 1698/2005) as part of the EU’s Common Monitoring and Evaluation Framework to assess the impact of RDP.
The Water Framework Directive (2000/60/EC) (WFD) is a legal obligation to protect and restore the quality of waters across Europe. Measures applied under the Water Framework Directive affecting the use of nitrogen in agriculture relate to best environmental practices and include the reduction of nutrient application, the modification of cultivation techniques and the proper handling of fertilisers. Most measures suggested in this context are aimed at reducing the influx of nutrients, such as nitrogen, phosphorus as well as pesticides to the groundwater as well as surface waters. The N balance surplus (every 6 years at level of water body catchment) is a commonly used indicator for identifying areas vulnerable to nutrient pollution in the WFD pressures and impacts analysis.
The Nitrates Directive (91/676/EEC) (ND), established in 1991, aims to reduce water pollution caused or induced by nitrates from agricultural sources and prevent further such pollution. The directive requires the Member States to monitor nitrate concentrations in surface water and groundwater, identify waters affected by pollution and waters which could be affected by pollution if no measures are taken and designate vulnerable zones, defined as all known areas of land which drain into the waters identified. For these vulnerable zones, action programmes containing measures to reduce and prevent nitrate pollution must be developed, implemented and revised every four years. The action programmes of MS should contain rules relating to the limitation of the land application of fertilizers based on a balance between the foreseeable nitrogen requirements of the crops, and the nitrogen supply to the crops from the soil and fertilization. These balances should be calculated at farm level every 4 years.
The 6th Environmental action Programme (European Commission, 2001) encourages the full implementation of both the ND and WFD, in order to achieve levels of water quality that do not give rise to unacceptable impacts on, and risks to, human health and the environment.
Further Eurostat information
Publications
Main tables
- Title(s) of second level folder (if any)
- Title(s) of third level folder (if any)
Database
- Title(s) of second level folder (if any)
- Title(s) of third level folder (if any)
Dedicated section
Methodology / Metadata
<link to ESMS file, methodological publications, survey manuals, etc.>
- Name of the destination ESMS metadata file (ESMS metadata file - ESMS code, e.g. bop_fats_esms)
- Title of the publication
Source data for tables, figures and maps on this page (MS Excel)
Other information
<Regulations and other legal texts, communications from the Commission, administrative notes, Policy documents, …>
- Regulation 1737/2005 of DD Month YYYY on ...
- Directive 86/2003 of DD Month YYYY on ...
- Commission Decision 86/2003 of DD Month YYYY on ...
<For other documents such as Commission Proposals or Reports, see EUR-Lex search by natural number>
<For linking to database table, otherwise remove: {{{title}}} ({{{code}}})>
External links
See also
Notes
[[Category:<Subtheme category name(s)>|Statistical article]] [[Category:<Statistical article>|Statistical article]]


