International trade in goods by partner
Data extracted in June 2024
Planned article update: no update planned
Highlights
In 2023, the 4 principal partners for goods exported from the EU and goods imported to the EU were the United States, China, the United Kingdom and Switzerland.
In 2023, China had the most goods imported into the EU while the United States received the most goods exported by the EU.
Globalisation patterns in EU trade and investment is an online Eurostat publication presenting a summary of recent European Union (EU) statistics on economic aspects of globalisation, focusing on patterns of EU trade and investment.
Shares in world export markets have traditionally been used as a measure of a country's industrial competitiveness. However, with an increasing share of trade in intermediate goods (as a result of integrated supply chains and globalised production), such conventional indicators have become less informative, as high export shares might be simply related to assembly activities, whilst much greater shares of value added may be contained in other stages of production (design, marketing, logistics, after-sales). The increasing reliance on global production chains accelerated around the turn of the millennium and through to the onset of the financial and economic crisis. Nowhere was this more evident than in China, which developed into a 'processing hub' for Asia and became a member of the World Trade Organisation (WTO) in December 2001. Other important developments are the establishment and expansion of a broad range of global trade agreements designed to encourage increased levels of free-trade (for example, ASEAN, COMESA, Mercosur or NAFTA). This article looks at the development of the EU's trading relationships with some of its most important trade partners.
Full article
Focus on EU trade in goods - an overview
In 2023, the four principal destinations for goods exported from the EU were the United States, China, the United Kingdom and Switzerland
Extra-EU trade flows (imports plus exports) for the whole of the EU were valued at €4 072 billion in 2019, more than twice as high as in 2002. In 2020, due to the COVID-19 pandemic this fell to €3 647 billion in 2020. However in 2021 and 2022 it recovered strongly, reaching €5 576 billion in 2022 before falling to €5 074 billion in 2023. A majority of the EU's trade takes place within the single market (in the form of intra-EU trade flows), the share that originates in or is destined for non-member countries did not change much over time, decreasing from 39.8% of the total in 2002 to 38.4% by 2023.
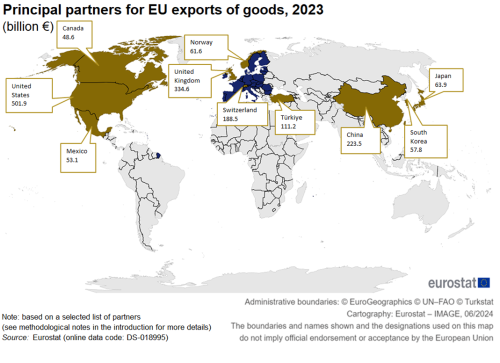
In 2023, the principal destinations for goods exported from the EU included the United States, the United Kingdom, China, and Switzerland. The list of the EU's top 10 export markets for goods is completed with Türkiye, Japan, Norway, South Korea, Mexico and Canada (see Map 1).
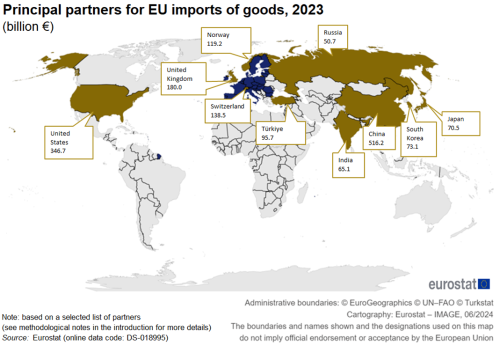
A ranking of the principal origins of goods reveals that China was the EU's principal partner for imported goods in 2023, followed by the United States, the United Kingdom and Switzerland. The remainder of the ranking for goods imported into the EU was composed of Norway, Türkiye, South Korea, Japan, India and Russia (see Map 2).
In 2023, EU imports from China were 7 times as high as in 2002
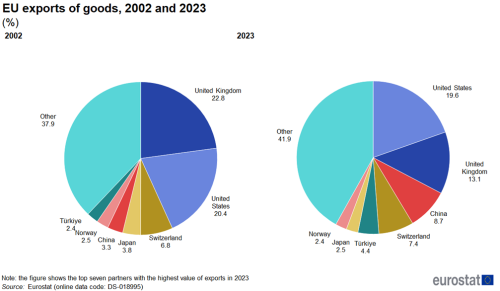
In 2002, half of EU exports went to the United Kingdom (22.8%), the United States (20.4%) and Switzerland (6.8%) combined, as shown in Figure 1. By 2023, the United States (19.6%) and the United Kingdom (13.1%) had switched places and Switzerland was replaced by China (8.7%) whose share had more than doubled since 2002.
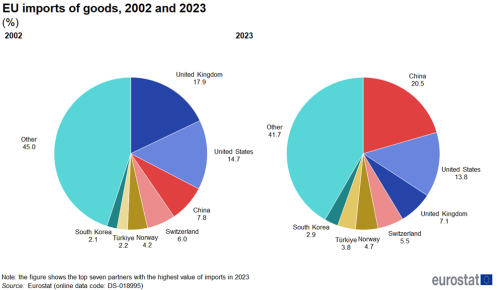
On the import side, the share of EU imports originating in China increased from 7.8% of the total in 2002 to 20.5% by 2023, making China the main partner for imports. In the same period, the share of imports from the United States fell from 14.7 % to 13.8 % while the share from the United Kingdom dropped from 17.9% to 7.1% (see Figure 2).
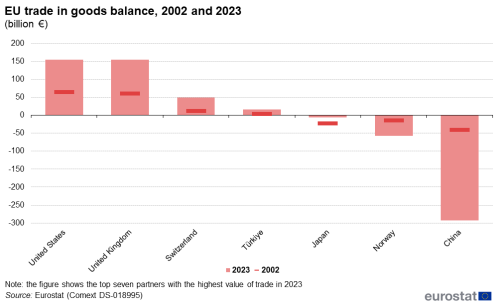
The EU ran a trade deficit for goods with China of €293 billion in 2023 (see Figure 3). It also had a sizeable trade deficit with Norway (€58 billion) and Japan (€7 billion). By contrast, the EU recorded trade surpluses with the United States, the United Kingdom (both €155 billion), Switzerland (€50 billion) and Türkiye (€16 billion).
Realignment of the EU's principal partners for trade in goods towards emerging economies
While absolute figures show that EU trade in goods is relatively concentrated with respect to its principal partners, there has been a considerable realignment of the EU's trading relationships in recent years, with a shift in bilateral trading relationships towards emerging economies, while trade flows with traditional partners tended to develop at a much slower pace. Emerging economies have captured an increasing share of global trade which has often stimulated their domestic economic growth, sometimes leading to the emergence or expansion of a middle class, while removing parts of their populations from the risk of poverty.
On the export side, the most rapid growth for EU trade concerned an expansion in the value of goods destined for China (+583% between 2002 and 2023), while the value of EU exports to Ukraine, Türkiye, Morocco, India, South Korea, Mexico, Egypt and the United Arab Emirates also increased strongly (see Figure 4). On the import side, China (+601% between 2002 and 2023) had the second largest growth behind the United Arab Emirates (+843%). The value of EU imports from India, Mexico, Nigeria, Türkiye, Egypt, Morocco, South Korea, Ukraine, Saudi Arabia and Norway also increased strongly.
The pace of growth was generally much slower for the EU's more traditional trading partners and developed world economies. Low growth rates for both imports and exports were found for the United Kingdom, Japan and Hong Kong while due to trade restrictions, exports to Russia did not grow much in this period and imports even fell.
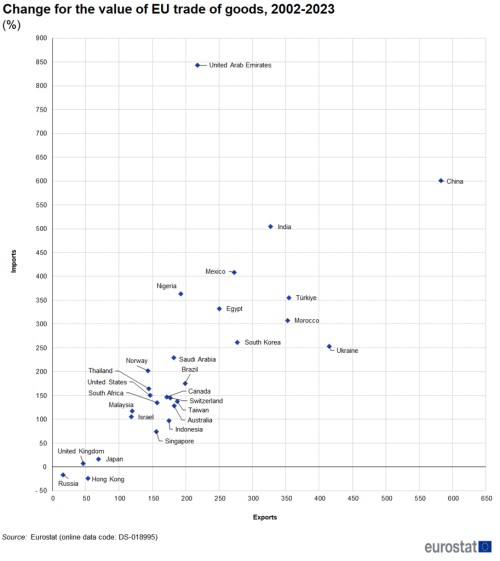
(%)
Source: Eurostat Comext DS-018995
Focus on EU trade in goods for selected partners
The following section presents information for the EU's 4 principal trading partners (as of 2023): the United States, China, the United Kingdom and Switzerland.
The United States overtook the United Kingdom as the EU's leading trade partner
Based on an analysis of the total value of trade in goods (in other words, the sum of exports and imports), the United States overtook the United Kingdom as the EU's principal trade partner in 2015, due to strong growth of exports to the United States. The United States lost its leading position to China in 2020 but regained it in 2022.
In recent years, EU exports destined for the United States have grown at a faster pace than the value of EU imports that originated from the United States; after the shock of the global financial and economic crisis, the EU trade surplus with the United States expanded from €42 billion in 2009 to €167 billion in 2021 dropping to €155 billion in 2023 (see Figure 5).
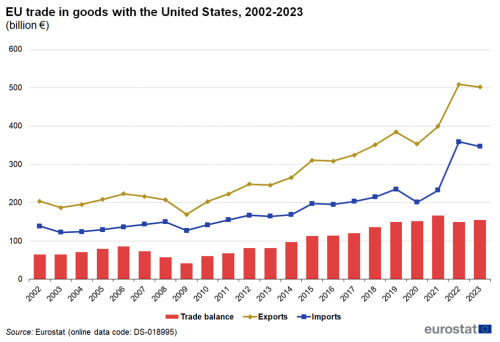
(€ billion)
Source: Eurostat Comext DS-018995
Machinery and transport equipment were the most commonly exported products from the EU to the United States making up 41.4% (€208 billion) of all EU goods. This was also the most imported product from the United States with a share of 31.0% (€107 billion).
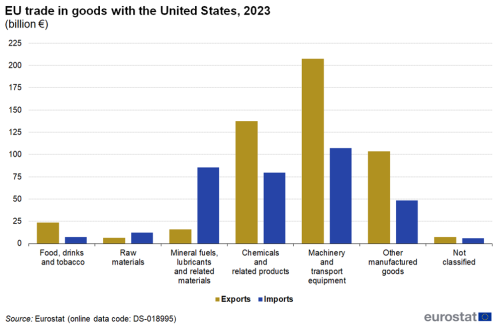
(€ billion)
Source: Eurostat Comext DS-018995
EU trade with China is heavily skewed in favour of Chinese imports
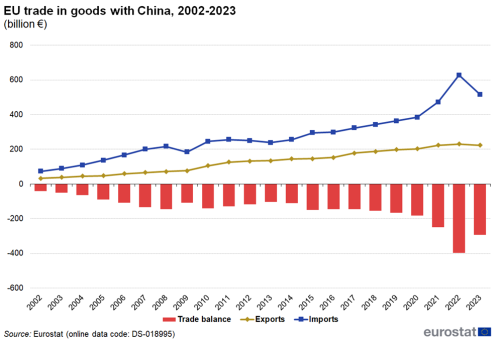
Figure 7 shows the EU ran a sizeable trade deficit with China throughout the period from 2002 to 2023. Between 2002 and 2023 it increased from €41 billion to €293 billion after having peaked in 2022 at €397 billion. In total trade, China overtook the United States in 2020 and became the EU's largest trade in goods partner. However, in 2022 the United States retook the first position.
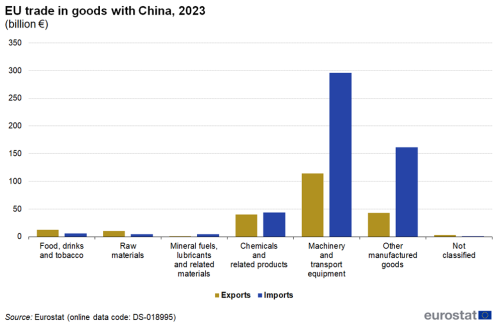
Machinery and transport equipment (57.4% or €296 billion) together with other manufactured goods (31.2% or €161 billion) made up almost 90 % of all goods imported into the EU from China in 2023. Turning attention to EU exports destined for China, machinery and transport equipment also represented more than half (51.2% or €114 billion) of the total in 2023, while the remaining exports were more evenly spread; other manufactured goods (19.1% or €43 billion) and chemicals and related products (17.8% or €40 billion) were the only other product groups to record double-digit shares (see Figure 8).
The EU trade surplus with the United Kingdom increased by €95 billion between 2002 and 2023
Between 2003 and 2008, the development of trade between the EU and the United Kingdom rose at a steady pace for both exports and imports (see Figure 9). There was a marked downturn in the value of EU trade with the United Kingdom in 2009. This was followed by a rapid expansion from 2009 to 2011. After that exports to the United Kingdom continued to grow while imports remained stable. In 2020 a combination of Brexit and the COVID-19 pandemic led to a decrease of trade between the EU and the United Kingdom. By 2023 exports were above 2019 levels (€335 billion vs. €320 billion) while imports (€180 billion vs. €194 billion) were below, resulting in a trade surplus of €515 billion.
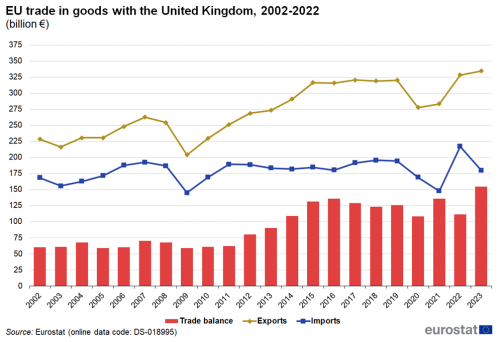
(€ billion)
Source: Eurostat Comext DS-018995
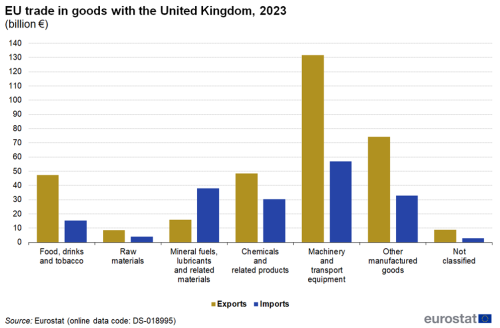
Figure 10 shows the structure of EU trade with the United Kingdom in 2023 in more detail. The highest value of EU exports to the United Kingdom was recorded for machinery and transport equipment (€131 billion) and other manufactured goods (€74 billion). These were also the goods with highest value of imports into the EU that originated from the United Kingdom a value of €57 billion for machinery and transport equipment and €33 billion for machinery and transport equipment. Combining these data for 2023, it shows that the EU ran sizeable trade surpluses with the United Kingdom for machinery and transport equipment (€75 billion) and for other manufactured goods (€41 billion), whereas it had a deficit of €22 billion for mineral fuels, lubricants and related materials.
(€ billion)
Source: Eurostat Comext DS-018995
The EU trade surplus with Switzerland quadrupled between 2002 and 2023
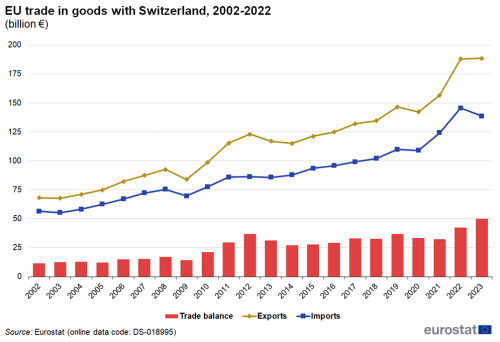
Between 2003 and 2008, the development of trade between the EU and Switzerland rose at a steady pace for both exports and imports (see Figure 11). There was a marked downturn in the value of EU trade with Switzerland in 2009. This was followed by a rapid expansion from 2009 to 2011. Both EU imports from and exports to Switzerland increased until 2019, before falling slightly in 2020. However, since then they increased strongly and in 2023 imports stood at €139 billion while exports reached €188 billion.
(€ billion)
Source: Eurostat Comext DS-018995
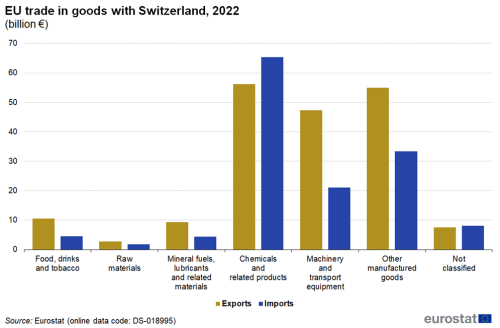
Figure 12 shows the structure of EU trade with Switzerland in 2023 in more detail. The highest value of EU exports to Switzerland was recorded for chemicals (€56 billion), other manufactured goods (€55 billion) and machinery and transport equipment (€47 billion). On the import side, the highest value of goods imported into the EU that originated from Switzerland was for chemicals (€65 billion) followed by other manufactured goods (€33 billion) and machinery and transport equipment (€21 billion). Combining these data for 2023, it shows that the EU ran sizeable trade surpluses with Switzerland for other manufactured goods (€22 billion) and for machinery and transport equipment (€26 billion), whereas it had a deficit of €9 billion for chemicals.
Focus on trade in goods for individual EU Member States
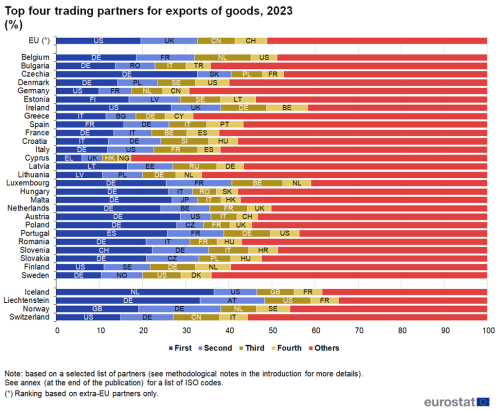
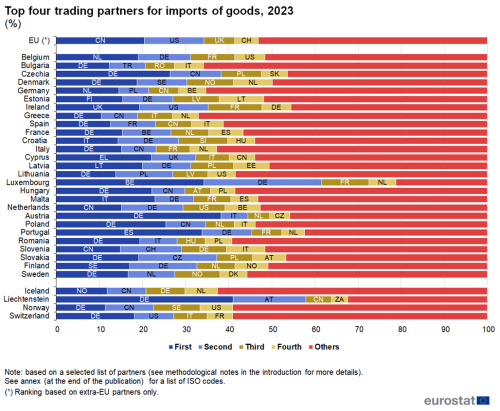
Having analysed extra-EU trade developments for some of the EU’s main trading partners, this next section identifies the leading trade partners for individual EU Member States (considering both intra-EU and extra-EU partners), detailing the 4 principal trade partners for both exports (see Figure 13) and imports (see Figure 14).
In 2023, 15 EU Member States reported that Germany was their largest export market for goods …
In 2023, Germany was among the 4 most important export markets (in value terms) for all but 2 of the (other) EU Member States, the exceptions being Estonia and Cyprus. This is perhaps unsurprising given that Germany has the highest number of inhabitants in the EU and is also located relatively centrally. Germany occupied the position of the leading export partner for 15 of the Member States and when this was not the case, the exceptions were mostly located around the periphery of the EU — the Baltic Member States, Finland, Ireland, Spain, Portugal, Greece, Croatia, Slovenia and Cyprus. The United States was the leading market for goods exported from Germany, Finland and Ireland, while the other countries mostly had neighbouring countries as their largest partner for exports.
… and Germany was also the main origin of imported goods in 14 EU Member States
Germany was also the main origin of imported goods for 14 of the EU Member States in 2023, while Germany featured among the top 4 import partners for each of the remaining Member States except Cyprus. In those cases where Germany was not the leading import partner, this position was usually occupied by a neighbouring country — for example, the Netherlands was the main origin of imports from Belgium, Spain for Portugal, Lithuania for Latvia, Sweden for Finland and Greece for Cyprus.
(%), Country codes
Source: Eurostat (DS-018995) and (DS-043227)
(%), Country codes
Source: Eurostat (DS-018995) and (DS-043227)
In 2023, eight EU Member States recorded their largest trade surplus for goods with the United States
Tables 1 and 2 provide a similar set of information but focus instead on the largest trade surpluses and trade deficits for each of the EU Member States. In 2023, a minority (10) of the Member States recorded their largest bilateral trade surpluses for goods with another Member State; in 5 of these cases, Germany was the partner. There were 8 Member States where the largest trade surplus was recorded with the United States as a partner and four with the United Kingdom.
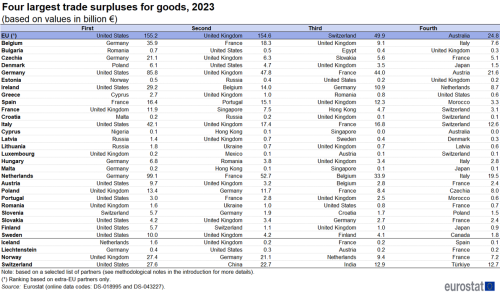
(based on values in (€ billion))
Source: Eurostat (DS-018995) and (DS-043227)
The 'Rotterdam effect'
Extra-EU imports and exports are reported by the EU Member State according to where the customs declaration is lodged, usually this is the place where the goods cross the EU's external frontier (their point of entry/exit).
The geographical allocation of extra-EU flows is therefore biased insofar as the entry/exit Member State is not the actual importing/exporting Member State. This issue particularly impacts on the transhipment of extra-EU imports into some of the EU's leading ports such as Rotterdam (in the Netherlands) or Antwerp (in Belgium). As such, the trade flows of some Member States may be over- or underestimated due to the so-called 'Rotterdam effect' (quasi-transit trade). For example, goods which arrive in Dutch (or to a lesser degree Belgian) ports, but which are bound for other EU Member States, should according to EU rules be recorded as extra-EU imports in the Netherlands (or Belgium), where they may be released for free circulation around the single market. This phenomenon in turn increases intra-EU trade flows between the Netherlands (and Belgium) and those Member States where the goods ultimately arrive.
At an aggregate level, the EU's largest trade deficit for goods in 2023 was recorded with China. This pattern was repeated in 7 of the individual EU Member States. There were 4 Member States where the largest trade deficit was recorded with Germany which occupied a second, third or fourth position in another 10 Member States. The largest deficits in Belgium, Germany and France were recorded in relation to the trading of goods with the Netherlands, which also featured in second, third or fourth position for an additional 12 Member States; this may at least in part, reflect the dominant position of Rotterdam as the EU's leading maritime port, acting as an entry point into the EU's single market for a wide range of goods from the rest of the world.
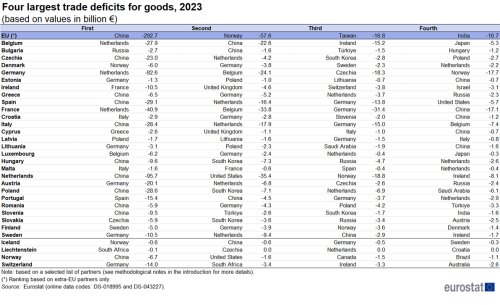
(based on values in (€ billion))
Source: Eurostat (DS-018995) and (DS-043227)
The fastest growth rates for intra-EU trade were recorded among those Member States that joined the EU in 2004 or later …
The article International trade in goods for the EU - an overview already provided evidence that a majority of the EU's trade in goods takes places within the single market, and the share of intra-EU trade in total trade was relatively stable between 2002 and 2023 (around 60%). Note that the statistics presented in this publication have been standardised to present consistent aggregates for the whole of the EU throughout the time period under consideration (generally from 2002 to 2023).
There were 16 Member States where the share of intra-EU imports and exports increased between 2002 and 2023. Among those were 10 of the 13 Member States that joined the EU in 2004 or more recently (Figure 15); the 3 exceptions were Cyprus, Slovakia and Slovenia. The share increased most in Malta (+11.7 percentage points (pp)), Lithuania (+11.5 pp) and Estonia (+9.1 pp). The share dropped most in Slovenia (-23.0 pp), Spain (-4.5 pp) and Greece (-3.9 pp).
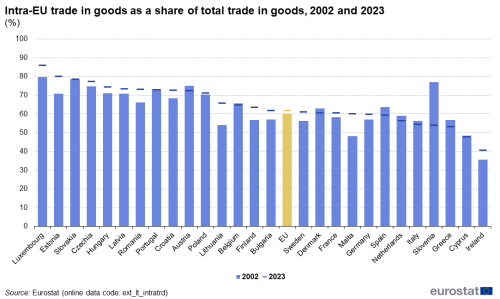
(%)
Source: Eurostat (ext_lt_intratrd)
Source data for tables and graphs
Direct access to
