Spillover effects of EU consumption
Data extracted in April 2024.
No planned article update.
Highlights
This article is a part of a set of statistical articles, which are based on the Eurostat publication ’Sustainable development in the European Union — Monitoring report on progress towards the SDGs in an EU context — 2024 edition’. This report is the eighth edition of Eurostat’s series of monitoring reports on sustainable development, which provide a quantitative assessment of progress of the EU towards the SDGs in an EU context.
Full article
The EU in the world: a focus on selected SDG indicators
To end poverty, protect the planet and ensure that by 2030 all people enjoy peace and prosperity, it is not enough that only a few countries in the world achieve the SDGs. Instead, the 2030 Agenda must be fulfilled by the entire international community. This section shows the situation in the EU and in other major economies of the world, based on six indicators from the EU SDG indicator set. The selected EU indicators are fully aligned with the global UN indicators. Table 1 lists the economies selected for the comparison and illustrates their shares in global GDP, population and land area. Together, these economies accounted for 80 % of global GDP, 62 % of the global population, and 60 % of the global land area in 2022. The presentation of the indicators is organised according to the three dimensions of sustainability — social, economic and environmental. The respective graphs include those countries for which data are available.
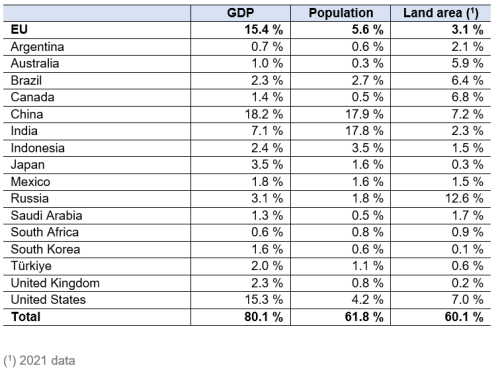
Source: World Bank (‘GDP, purchasing power parity (PPP), current internation $’), Eurostat (online data code: (demo_gind)), United Nations, Department of Economic and Social Affairs, Population Division (‘Total population by sex’) and FAOSTAT, Land use (‘Land area’).
Monetary poverty (SDG 1)
Thanks to a wide range of measures employed by Member State governments to reduce poverty, such as unemployment benefits, sickness benefits, progressive taxation, social and employment services, the EU’s at-risk-of-poverty rate after social transfers was the lowest among the major world economies, at 16.5 % in the income year 2021 [1]. For comparison, in the same year the United States’ at-risk of poverty rate was 22.7 %, meaning that almost a quarter of the country’s population was at risk of poverty. The numbers were even higher in countries with lower GDP per capita, such as Mexico, Brazil and South Africa (see Figure 1).
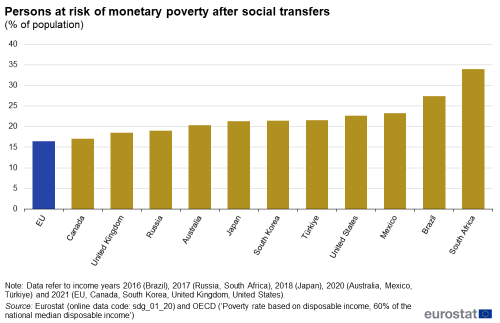
Source: Eurostat (online data code: (sdg_01_20)) and OECD (‘Poverty rate based on disposable income, 60% of the national median disposable income’)
Income inequality (SDG 10)
Among the world’s major economies, the EU has one of the lowest income inequalities, with the income quintile share ratio being at 4.74 in the income year 2021, second only to Canada (4.6 in 2021). In many other big economies of the world (see Figure 2), this ratio was between 5.1 (Russia) and 7.1 (USA). Income inequality was highest in South Africa, with the income quintile share ratio at 32.4 in 2017. This means the richest 20 % of the South African population earned more than 30 times more than the poorest 20 %.
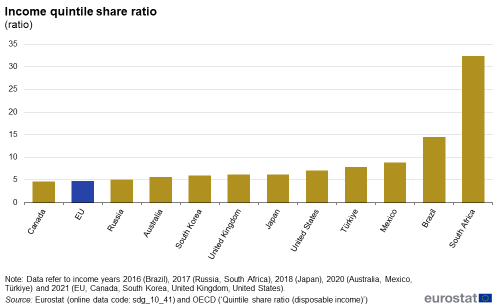
Source: Eurostat (online data code: (sdg_10_41)) and OECD (‘Quintile share ratio (disposable income)’)
Employment (SDG 8)
While the EU employment rate is mainly monitored for the age group 20 to 64, global data for the employment rate are only available for the age group 15 to 64 [2]. In 2023, the EU’s employment rate for this age group was 70.4 %. This is higher than in many major economies of the world (see Figure 3), such as South Korea, Indonesia or Argentina, but lower than in Japan (77.3 %), Canada (75.8 %) or the United States (72.0 %).
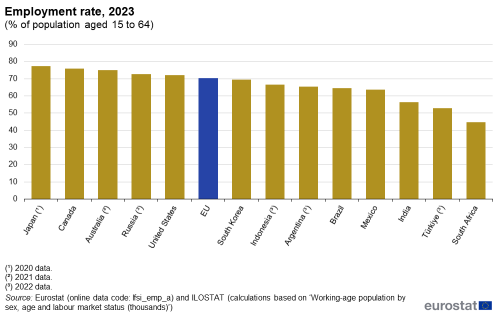
Source: Eurostat (online data code: (lfsi_emp_a)) and ILOSTAT (calculations based on ‘Working-age population by sex, age and labour market status (thousands)’)
Research & development intensity (SDG 9)
Research & development (R&D) intensity measures gross domestic expenditure on R&D as a share of GDP. In 2021, the EU spent 2.27 % of its GDP on R&D, which is lower than several other high-income countries such as South Korea, the USA and Japan, which reported R&D intensities of 4.93 %, 3.46 % and 3.30 %, respectively (see Figure 4). In the same year, China, which is an upper-middle income country [3], also surpassed the EU in its R&D intensity, by spending 2.43 % of its GDP on R&D. However, the EU had a higher R&D intensity than other high-income countries, such as Canada and Australia, and also surpassed many middle-income economies. The EU’s R&D intensity was also higher than the world average (1.93 % in 2021), but lower than in some regions of the world, such as South-Eastern Asia (2.71 %) and Northern America (3.32 %), and also lower than the average of high-income countries (2.76 %).
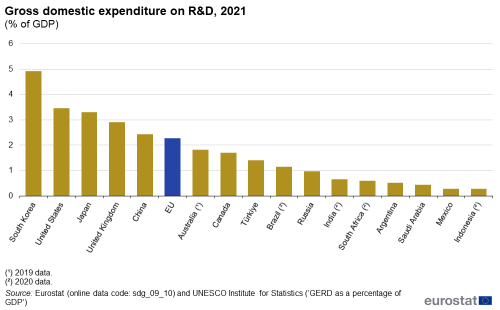
Source: Eurostat (online data code: (sdg_09_10)) and UNESCO Institute for Statistics (‘GERD as a percentage of GDP’)
Greenhouse gas emissions (SDG 13)
In 2021, the EU’s greenhouse gas (GHG) emissions reached 7.7 tonnes per capita. This was around two and a half times less than in Australia (20.2 tonnes per capita), Saudi Arabia (19.7 tonnes per capita) or the USA (19.1 tonnes per capita). In the same year, the EU’s per capita emissions were one of the lowest among other high-income economies (see Figure 5), second only to the UK (6.3 tonnes per capita). Nevertheless, the EU’s emissions were higher than in several other major economies, such as India, Indonesia and Mexico. The EU’s emissions were also higher than the world average (6.3 tonnes per capita), but considerably lower than the OECD average (11.2 tonnes).
When comparing GHG emissions in absolute terms, China’s emissions were by far the highest in 2021, with 14.4 gigatonnes (Gt), followed by the USA (6.3 Gt), the EU (3.5 Gt) and India (3.4 Gt). In terms of cumulative emissions over the period 2000 to 2021, China contributed 231 720 Gt, which is almost as much as the combined emissions of the United States (153 140 Gt) and the EU (89 770 Gt).
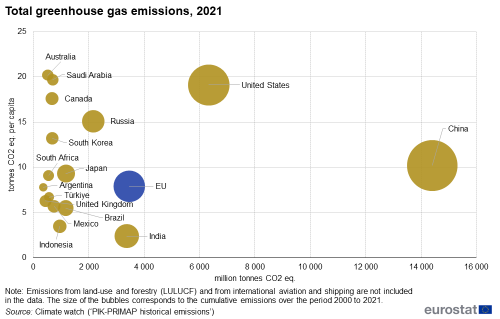
Source: Climate watch (‘PIK-PRIMAP historical emissions’ [4])
Share of forest area (SDG 15)
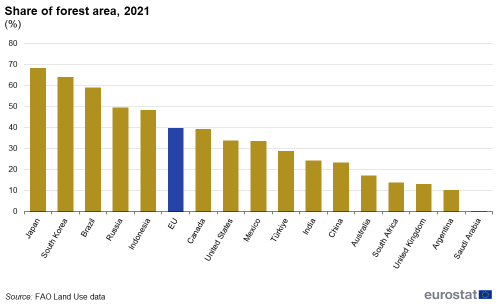
According to FAO data, the EU’s share of forest area constituted 39.9 % in 2021 [5]. This was higher than in many other major economies of the world, such as the United States, Mexico, Australia or India (see Figure 6). Among the G20 economies, Japan had the largest proportion of forest area, at 68.4 %, followed by South Korea at 64.3 %. Saudi Arabia, with most of its terrain being a desert, only had 0.5 % of its territory covered by forests. Between 2000 and 2021, the share of forest area remained stable or increased slightly in most of the world’s major economies. Notable exceptions include Brazil and Indonesia, where the forest area shrunk by 6.7 and 5.6 percentage points, respectively.
Globally, 31.2 % of land area was covered by forest in 2021. Among the regions, South America had the highest share of forest area, at 48.2 %, followed by South-eastern Asia at 46.7 %. In contrast, only 3.3 % of land in Central Asia was covered by forest. It should be noted that a country’s share of forest area depends not only on land management but also on natural factors such as climate, soil and topography.
Estimating spillover effects of EU consumption
In a globalised world, countries’ actions towards sustainable development may positively or negatively influence other countries and their capacity to achieve their SDGs. Therefore, governments and societies need to consider the impact that their domestic policies and behaviour may have beyond national borders, to avoid negative environmental, social and economic externalities and to foster sustainable development on a global scale. The impact that activities in one sector, region or country have on other sectors, regions or countries are called spillover effects (or simply ‘spillovers’). Spillovers may result from deliberate transboundary actions, such as official development assistance (ODA), or be an unintended consequence of domestically focused policies or of the consumption of natural resources embodied in trade [6].
Spillover effects can be calculated in different ways. Prominent methods use consumption-based accounts [7], thereby focusing on international environmental, social and economic impacts that are driven by domestic consumption. Spillover effects in this chapter are measured by four indicators: carbon dioxide (CO2) footprint, material footprint, land footprint and gross value added (GVA). CO2 footprint and GVA have been estimated with the FIGARO multi-regional input-output model [8], while material and land footprints use different, less detailed models. For more information, please see the explanatory note on the Eurostat website.
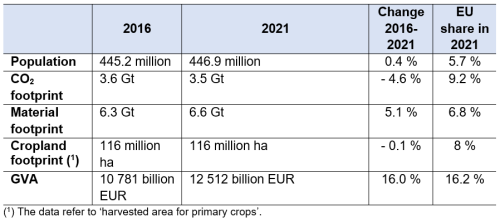
To put the EU’s emissions and consumption into perspective, data are compared with the EU’s share of the global population (see Table 2). In 2021, the EU’s population was 447 million people, which represented 5.7 % of the world population, compared with 5.9 % five years before [9].
CO2 footprint
The CO2 footprint, or carbon footprint, measures carbon dioxide emissions classified by final use of products in the EU. In other words, it measures the amount of CO2 emissions that can be traced back to consumption within the EU’s borders. It comprises both the emissions originating in the EU and those originating abroad but serving the EU’s consumption. The CO2 footprint has been estimated using the FIGARO input-output model.
In 2021, 9.2 % of the global CO2 emissions could be traced back to the EU
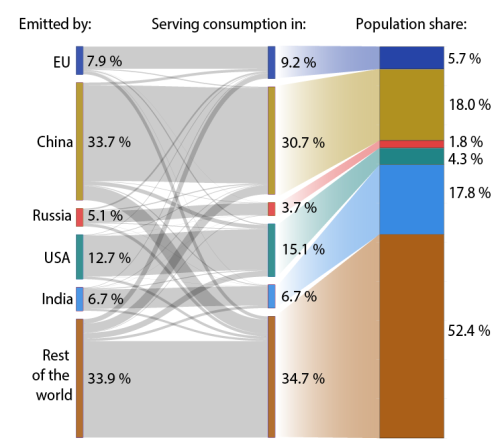
Comparing the EU with other economies of the world puts the effects of EU’s consumption on other countries into perspective. As shown in Figure 7, 9.2 % of the global CO2 emissions could be traced back to the EU’s consumption in 2021. This indicates that the EU generates a disproportionally high share of the world’s emissions when compared with its share of the global population (5.7 %).
However, a similar pattern can also be seen for the other main economies of the world. With a population of 1.43 billion, China’s share of the world population was 18.0 % in 2021, while its consumption accounted for almost a third (30.7 %) of the world’s emissions in that year. An even larger discrepancy between the shares in population and in global CO2 emissions could be observed for the United States. While the country was home to 4.3 % of the world’s population, its share in global emissions was more than three times higher, at 15.1 %. India, on the other hand, hosted 17.8 % of the global population, but caused only 6.7 % of global CO2 emissions. The rest of the world (excluding China, EU, the USA, India and Russia) accounted for more than half (52.4 %) of the world population, while only 34.7 % of global CO2 emissions could be attributed to these countries in 2021.
Almost a third of the CO2 emissions serving EU consumption are generated outside of the EU
As illustrated in Figure 7, most of the CO2 emissions serving consumption in the world’s main economies are also generated in these countries, meaning that none of these countries is generating more emissions abroad than it does domestically.
Source: Eurostat, JRC (estimates based on FIGARO data as well as (demo_gind) and https://population.un.org/wpp/)
In 2021, 2.4 gigatonnes (Gt), corresponding to 69 % of the total CO2 emissions serving the EU’s consumption, were generated in the EU, while 1.1 Gt of global CO2 emissions serving EU consumption originated from non-EU countries. From these non-EU countries serving EU’s consumption, China had the largest share with 0.3 Gt or around 28 %. This reflects that China is the EU’s main trading partner for imports: in 2021, the share of EU total imports (in value) originating from China amounted to 22.2 % [10].
In 2021, Russia accounted for 0.17 Gt CO2 emissions serving the EU’s consumption [11], followed by the United States and India (0.05 Gt each). Notably, while embodied emissions from Russia exceeded those from the US, the share in the value of US imports in total EU imports was higher (11.0 %) than from Russia (7.7 %) [12]. This might be explained by the fact that a substantial part of imports from Russia were semi-manufactured low-value products such as steel [13], which generate relatively high CO2 emissions during their production.
The EU’s CO2 footprint increased between 2016 and 2021
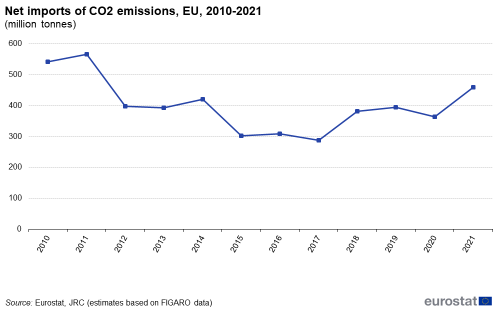
Between 2010 and 2021, the CO2 emissions embodied in imported goods and services for the EU’s consumption had been higher than the emissions embodied in the EU’s exports, making the EU a net importer of CO2 emissions. In 2021, the volume of CO2 emitted in the rest of the world serving EU consumption stood at 1.1 Gt, while 0.6 Gt CO2 were emitted by the EU economy to produce goods that were exported to the rest of the world. This resulted in a net import of 0.5 Gt of CO2 emissions.
Between 2010 and 2021, the physical trade balance of the EU’s CO2 footprint decreased by 15.3 % (see Figure 8). This indicates that in 2021 the EU’s spillover effects caused by consumption were less than 11 years earlier. However, this progress was mostly achieved between 2011 and 2017. In the short-term period between 2016 and 2021, the EU’s net imports increased by almost 50 %. This growth in net imports of CO2 emissions was driven by an increase in imports and a simultaneous decrease in exports.
Material footprint
The material footprint, also referred to as raw material consumption, shows the amount of materials required along the supply chains of the goods and services finally consumed in a country. Eurostat estimates the material footprint by calculating the actual weight of materials extracted to produce the traded goods — the so-called raw material equivalents of imports and exports — instead of the weight of the goods crossing country borders. In other words, the weight of processed goods traded internationally is converted into the corresponding raw material extraction that was required to make them. This is typically two to three times more than the actual weight of the exported goods.
Since the material footprint captures resources used along international supply chains to produce final goods, it is a useful tool for assessing spillovers in material consumption. It highlights the increasing spatial separation of production and consumption and the relocation of environmental impacts associated with material extraction. All raw materials extracted and used worldwide are allocated to domestic final consumption. Thus, outsourcing of material-intensive extraction and processing does not reduce a country’s overall material footprint. The material footprint is measured with the help of single region input–output modelling.
The EU consumed 6.8 % of the world’s raw materials in 2021
In 2021, the EU population consumed 6.6 Gt of raw material, which corresponds to 6.8 % of the raw material consumed globally. The EU’s share of global raw material consumption was thus around 1 percentage point above its population share. Of all the raw materials serving the EU’s consumption, 4.2 Gt or around 64 % were extracted in the EU, while 2.4 Gt were extracted outside the EU’s borders. This means that around one-third of the raw materials needed for EU consumption were imported.
The EU’s net imports of raw materials have decreased slightly since 2016
In 2021, the EU was a net importer of raw materials, meaning that the amount of materials needed for its consumption extracted outside the EU (2.4 Gt) exceeded the amount of materials exported to third countries for their consumption (1.3 Gt).
Figure 9 shows that between 2010 and 2021 the trade of raw materials in the EU became somewhat more balanced. While in 2010 net imports of raw materials for EU consumption constituted 1.2 Gt, this value dropped to 1.0 Gt in 2021 — a decrease of around 12 %. Between 2016 and 2021, net imports decreased by around 4 %. Over this period, the strongest drop occurred in 2020, when net imports fell by around 14 % compared with the previous year, most probably due to the reduced economic activity during the onset of the COVID-19 pandemic.
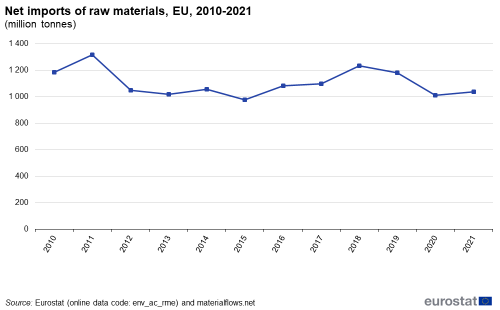
Source: Eurostat (online data code: (env_ac_rme)) and materialflows.net
Land footprint
The land footprint — or virtual land — refers to the estimated amount of land needed to produce one unit of a given final product consumed in a country, regardless of where in the world the land was. Land footprints highlight the EU’s dependency on foreign land embodied in goods and services consumed within the EU. While land use itself does not show concrete and direct environmental impacts, it may serve as a proxy for the pressure on ecosystems and biodiversity stemming from production and consumption systems. This chapter focuses on cropland that is used to cultivate crops. The data are modelled based on land use coefficients of imported agricultural products.
In 2021, crops cultivated for the EU’s consumption utilised 8 % of the global cropland
In 2021, the EU consumed crops cultivated on an equivalent of about 116 million hectares (ha) of cropland located both inside and outside the EU, representing about 8 % of the world’s cropland. Crops produced within the EU’s borders required 66 million ha of land, while 50 million ha outside the EU were used for crops serving EU consumption. At the same time, crops exported by the EU required around 28 million ha of cropland. The discrepancy between the imported and exported cropland makes the EU a net importer of around 22 million ha of cropland, which is about 23 % of EU cropland and about the size of Belgium, the Netherlands, Denmark, Slovenia and Austria together. Since 2016, the EU’s net imports of cropland required for cultivating crops for EU consumption have increased by around 5 % (see Figure 10). This increase can be largely attributed to an increase in imported cropland over this period while exported cropland remained stable.
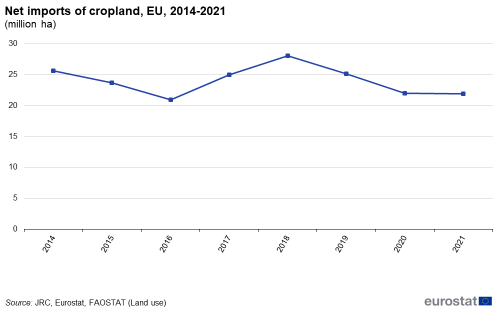
Source: JRC, Eurostat, FAOSTAT (Land use)
Gross value added (GVA)
GVA is the difference between an economy’s output and intermediate consumption (excluding taxes less subsidies on products), and is the main element of GDP. It is a good approximation of the size of the economy from a production perspective. FIGARO data allow GVA to be estimated for economies inside and outside the EU and therefore can be used to show the economic value generated outside the EU for consumption inside the EU.
The EU is a net exporter in value added terms
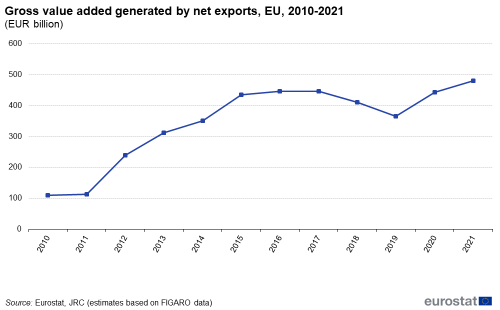
In 2021, total value added generated by the EU final demand was about EUR 12 500 billion. From this amount, around EUR 1 669 billion or 13 % were generated in non-EU economies. By comparison, value added generated in the EU by the non-EU final demand was around one-third higher, at EUR 2 151 billion. This makes the EU a net exporter in value added terms and mirrors the export surplus of the EU economy.
Since 2010, the value added generated outside the EU by the EU final demand has increased by around 40 %, while the value added generated in the EU by non-EU final demand has increased by around 66 %. This means that the gap between the value added generated in the EU by non-EU final demand and the one generated outside the EU by EU final demand has been widening, making the EU a larger exporter in value added terms over time, although the trend has slowed over the past five years.
Direct access to
More detailed information on EU SDG indicators for monitoring of progress towards the UN Sustainable Development Goals (SDGs), such as indicator relevance, definitions, methodological notes, background and potential linkages can be found in the introduction as well as in Annex II of the publication ’Sustainable development in the European Union — Monitoring report on progress towards the SDGs in an EU context — 2024 edition’.
Notes
- ↑ The term ‘income year’ is used to emphasize that the data refer to the year for which survey respondents provide their income data, which might differ from the year in which the data are collected. For the EU, data are collected through EU-SILC and are labelled according to the year of the data collection, meaning that data labelled as 2022 refer to people’s incomes in 2021.
- ↑ To note that setting a lower boundary for the age group at 15 years results in higher employment numbers in countries where compulsory education for young people ends at 15 years or earlier. This is the case for Brazil, Japan, Russia, South Africa South Korea and for 7 out of the 27 Members States in the EU; see European Education and Culture Executive Agency (2023), Compulsory education in Europe 2023/2024.
- ↑ The World Bank divides economies into four income groups, based on their gross national income (GNI) per capita: low, lower-middle, upper-middle, and high income. For more details see the World Bank’s website.
- ↑ Gütschow, J., Jeffery, M. L., Gieseke, R., Gebel, R., Stevens, D., Krapp, M., and Rocha, M. (2016), The PRIMAP-hist national historical emissions time series, Earth Syst. Sci. Data, 8, 571–603.
- ↑ The data presented here are sourced from the FAO and are thus not comparable with the data on forest area presented in the chapter on SDG 15 ‘Life on land’, which are derived from Eurostat’s Land Use and Cover Area frame Survey (LUCAS).
- ↑ OECD/EC-JRC (2021), Understanding the Spillovers and Transboundary Impacts of Public Policies Implementing the 2030 Agenda for More Resilient Societies: Implementing the 2030 Agenda for More Resilient Societies, OECD Publishing, Paris.
- ↑ ‘Production-based’ means, for example, direct observation of CO2 emissions as they are generated, while ‘consumption-based’ refers to, for example, CO2 emissions that are generated throughout the supply chain and are hence ‘embodied’ in the products and services consumed. These CO2 emissions are generated before the products are consumed, in different locations, and scattered across supply chains that may involve many countries. To get the full picture of the net balance of a country or region in terms of inward and outward spillover effects, a combination of both approaches is needed.
- ↑ FIGARO stands for ‘Full International and Global Accounts for Research in input-Output analysis’ and comprises the EU inter-country supply, use and input-output tables (EU IC-SUIOTs). FIGARO tables are a new statistical product for economic modelling. Since 2021, they are produced annually, linking national accounts with data on business, trade and jobs for EU Member States and 18 main EU trading partners; a ‘rest of the world’ region completes the FIGARO tables. For more information on FIGARO, see European Commission, FIGARO tables: EU inter-country supply, use, and input-output tables.
- ↑ Calculations based on Eurostat (online data code: (demo_gind)) and https://population.un.org/wpp/.
- ↑ Source: Eurostat (online data code: (ext_lt_maineu)).
- ↑ CO2 contained in energy carriers such as crude oil or gas and imported into the EU is not included in the exporting country emission account, but will show up in the importing country’s balance when combusted for power generation. The CO2 emitted in Russia for serving EU consumption is therefore not a result of Russian gas imported into the EU.
- ↑ Source: Eurostat (online data code: (ext_lt_maineu)).
- ↑ Source: Eurostat (online data code: (ds-018995)).
