Archive:Enlargement countries - education statistics
Data extracted in March 2022.
Planned article update: May 2023.
Highlights
In 2020, the proportion of early leavers from education and training among persons aged 18-24 was the highest in Turkey among the candidate countries and potential candidates, with 27.5 % of young men and 25.8 % of young women.
In 2020, Montenegro had the highest proportion of persons aged 20-24 having attained at least an upper secondary level of education (96.1 %), while the lowest was in Albania (55.7 %).
In all candidate countries and potential candidates for which data is available, more men than women graduated from a science or technology discipline in 2019.
Persons of 30-34 years old having completed tertiary or equivalent education, 2010 and 2020
This article is part of an online publication and provides information on a range of education statistics for the European Union (EU) enlargement countries, in other words the candidate countries and potential candidates. Montenegro, North Macedonia, Albania, Serbia and Turkey currently have candidate status, while Bosnia and Herzegovina as well as Kosovo* are potential candidates.
The article gives an overview of education developments, presenting an analysis of the different educational levels in terms of enrolment, educational attainment and tertiary education.
Full article
Number of pupils and students
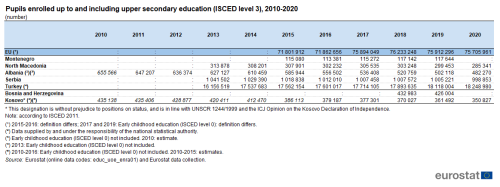
Table 1 presents the number of pupils attending up to and including upper secondary education (as covered by ISCED 2011 level 3) over the period 2010-2020 when data is available. Among the candidate countries and potential candidates, Turkey was the only country with a constant increase every year between 2013 and 2020, reaching 18.2 million pupils in 2020 after an increase of 13.0 % compared to 2013. Serbia showed a continuous decrease in enrolments between 2013 and 2020, with an exception in 2018 when the numbers only changed marginally. After a decrease of 4.1 % compared to 2013, Serbia registered 998.9 thousand pupils in 2020. Albania also reported a constant decrease in enrolments between 2010 and 2020, from 655.6 thousand pupils in 2010 to 482.3 thousand in 2020, representing a drop of 26.4 % between those two years. With data available for only two years, Bosnia and Herzegovina had 433.0 thousand pupils in 2018 and 426.0 thousand in 2019, a decrease of 1.6 %. Kosovo followed a negative trend 2010-2020, with the exception of a minor increase in 2011 (+0.1 %), registering an overall decrease of 19.4 % between 2010 (435.1 thousand pupils) and 2020 (350.8 thousand pupils). From 2013 to 2020, the number of pupils enrolled in North Macedonia also regularly decreased, except in 2017 (+1.1 %). Compared to 2013, North Macedonia recorded a decrease by 9.1 % in 2020, reaching 285.3 thousand pupils. After three consecutive increases in 2017, 2018 and 2019 (+1.7 %, +1.6 % and +0.4 %, respectively), Montenegro recorded 117.6 thousand pupils in 2019, which represented an increase of 2.2 % compared to 2015.
(number)
Source: Eurostat (educ_uoe_enra01) and Eurostat data collection
Overall in 2020, there were approximately 20.9 million pupils enrolled up to and including upper secondary education in the candidate countries and potential candidates (2019 data used for Montenegro and Bosnia and Herzegovina); this was equivalent to a little over one quarter (27.6 %) of the total number of pupils enrolled up to and including upper secondary education in the EU, which was 75.7 million in 2020.
While the absolute number of pupils and students is closely linked to the size and age structure of populations, there is a range of other factors that influence how long students remain in the education system, such as the length of compulsory schooling, opportunities in the labour market and the availability and cost of tertiary education. In recent years, policy interest has focused on encouraging young people to remain within educational systems so they may develop skills and gain qualifications that may help in the search for work in an increasingly knowledge-driven economy.
Early leavers from education and training
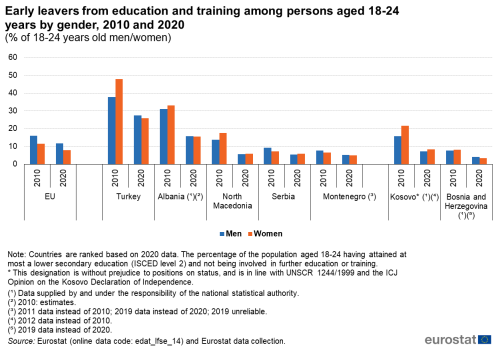
Figure 1 presents the share of early leavers (who finished at most a lower secondary education and were not involved in further education or training) from education and training among persons aged 18-24 years by gender in 2010 and 2020.
In 2020, the proportion of early leavers from education and training among persons aged 18-24 was the highest in Turkey, with at 27.5 % of young men and 25.8 % of young women. These proportions were also relatively high in Albania with 15.7 % of young men and 15.5 % of young women. However, there were lower proportions of early leavers from education and training in North Macedonia (5.7 % of young men and 5.8 % of young women), Serbia (5.4 % of young men and 5.8 % of young women) and Montenegro (5.2 % of young men and 4.9 % of young women – 2019 data). In Kosovo, 7.3 % of young men were early leavers and 8.4 % of young women, while in Bosnia and Herzegovina, 4.0 % of young men and 3.5 % of young women. In comparison, the proportion of early leavers from education and training in 2020 stood at 11.8 % in the EU among young men and 8.0 % among young women.
In 2020, Turkey, Albania, Montenegro (2019 data) and Bosnia and Herzegovina registered a higher proportion of early leavers for young men than for young women, as in the EU, whereas in North Macedonia, Serbia and Kosovo the reverse situation was observed.
Between 2010 and 2020, all candidate countries and potential candidates recorded decreases in their shares of early leavers. Albania and Turkey recorded the highest changes: in Albania, the proportion of early leavers decreased by 15.3 percentage points (pp) for young men and by 17.5 pp for young women, reversing the gender gap from +2.0 pp in 2010 to -0.2 pp in 2020; in Turkey, the proportion of early leavers decreased by 10.3 pp for men and by 22.1 pp for women, reverting the gender gap from +10.1 pp in 2010 to -1.7 pp in 2020. North Macedonia registered a smaller proportion of early leavers for young men than for young women between 2010 and 2020 (-8.0 pp and -11.7 pp, respectively), reducing the gender gap from +3.8 pp in 2010 to only +0.1 pp in 2020. In Serbia, the proportion of early leavers decreased more for men (by 3.8 pp) than for women (by 1.5 pp), shifting the gender gap from -1.9 pp in 2010 to +0.4 pp in 2020. Montenegro data shows also a higher decrease of early leavers for men (2.4 pp) than for women (1.7 pp), reducing the gender gap from -1.0 pp in 2011 to -0.3 pp in 2019 (data not available for 2010 and 2020). The proportion of early leavers decreased also in Kosovo between 2012 and 2020 (earlier data not available), by 8.4 pp for young men and by 13.2 pp for young women; the gender gap decreased from +5.9 pp in 2012 to +1.1 pp in 2020. Bosnia and Herzegovina’s proportion of early leavers also decreased, by 3.7 pp for young men and by 4.6 pp for young women; the gender gap shifted from +0.4 pp in 2010 to -0.5 pp in 2019 (data for 2020 is not available). EU’s proportion of early leavers for both young men and young women decreased between 2010 and 2020 by 4.1 pp and 3.6 pp, respectively, reducing the gender gap from -4.3 pp to -3.8 pp.
(% of 18-24 years old men/women)
Source: Eurostat (edat_lfse_14) and Eurostat data collection
Youth education attainment
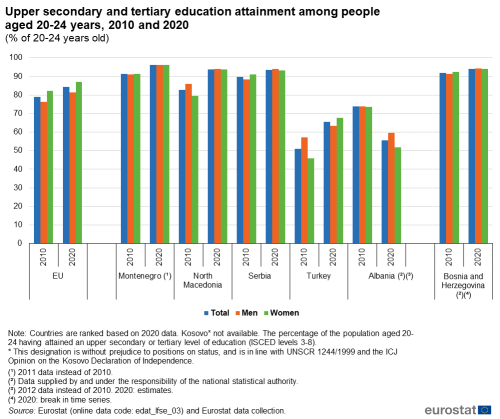
An alternative measure for analysing the outcomes of education systems is the youth education attainment level. This indicator is defined as the proportion of 20-24 year olds who have achieved at least an upper secondary level of education attainment (at least ISCED level 3). Data by gender are presented in Figure 2 as well as for the total population.
In 2020, there were four candidate countries and potential candidates which reported a higher proportion of persons aged 20-24 having attained at least an upper secondary level of education, compared to the EU. These were Montenegro (96.1 %), North Macedonia (93.9 %), Serbia (93.6 %) and Bosnia and Herzegovina (94.2 %). A considerably lower level of youth educational attainment was recorded in Turkey (65.6 %) and Albania (55.7 %). The share of the EU population aged 20-24 with at least an upper secondary level of education stood at 84.3 %.
(% of 20-24 years old)
Source: Eurostat (edat_lfse_03) and Eurostat data collection
The proportion of persons aged 20-24 having attained at least an upper secondary level of education rose between 2010 and 2020 in almost all candidate countries and potential candidates for which data is available; the only exception was Albania (2012-2020). The most notable increases were in Turkey (+14.5 pp) and North Macedonia (+11.1 pp). In the EU, the overall youth education attainment rose by 5.2 pp over the same period.
The highest change in gender gap took place in Turkey, with an increase of 15.7 pp between 2010 and 2020, reverting the gender gap from -11.2 pp more young men than young women having attained at least an upper secondary level of education in 2010 to +4.5 pp more young women than young men in 2020. North Macedonia recorded the second highest change in gender gap: it increased by 6.2 pp, from -6.5 pp in 2010 to -0.3 pp in 2020, bringing the gender gap closer to parity. Albania had the third highest gender gap between 2012 and 2020, with a decrease of 7.4 pp, from -0.2 pp to -7.6 pp in 2020, widening the gender gap. Serbia followed with a decrease of 3.6 pp, reverting the gender gap from 2.8 pp more young women than young men in 2010 to -0.8 pp more young men than young women in 2020. The gender gap in Bosnia and Herzegovina was also reversed following a decrease of 1.1 pp, from 1.0 pp in 2010 to -0.1 pp in 2020, being close to parity. The gender gap in Montenegro was already close to parity in 2011 (0.2 pp); following a decrease of 0.1 pp in 2020, it was even closer to parity, at only 0.1 pp more young women than young men having attained at least an upper secondary level of education. Within the EU, the gender gap in youth education attainment levels stood at 5.6 pp in 2020, with a higher level of attainment for young women than for young men, similar to the situation in 2010 (5.9 pp).
Tertiary education
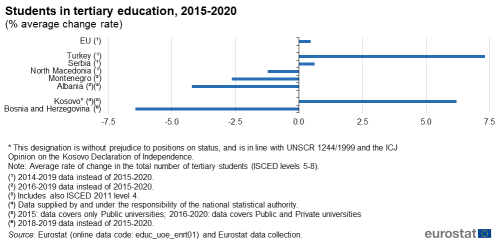
Figure 3 shows the annual average change rate of students in tertiary education (ISCED levels 5-8) between 2015 and 2020, or for another period for which data is available. Among the candidate countries and potential candidates, there was an increase in the number of tertiary students in three cases: Turkey (+7.3 % per year; 2014-2019 data), Kosovo (+6.2 %) and Serbia (+0.6 %; 2014-2019 data). An average decrease of 6.4 % per year was recorded in Bosnia and Herzegovina between 2018 and 2019. Between 2015 and 2020, an average decrease of 4.2 % per year was recorded in Albania, with smaller annual average decreases in Montenegro (2.6 % between 2016 and 2019) and North Macedonia (1.2 % between 2014 and 2019). Some of these changes in student numbers may reflect demographic developments (for example, a growing number of young people in countries characterised by relatively high birth rates, or an overall decline in the number of young people in those countries with declining rates), rather than changes in the uptake of tertiary education among young people. In comparison, the number of tertiary education students in the EU increased on average by 0.5 % per year between 2014 and 2019.
(% average change rate)
Source: Eurostat (educ_uoe_enrt01) and Eurostat data collection
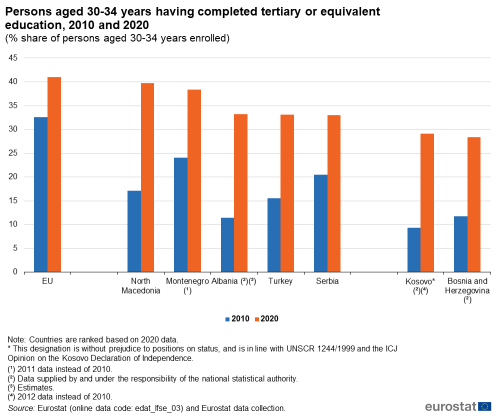
Figure 4 shows the proportion of 30-34 year olds who had completed a tertiary level of education. North Macedonia reported the highest proportion in 2020 among the candidate countries and potential candidates for which data are available, with 39.7 %; followed by Montenegro with 38.4 %. The other countries ranged just under one third in Albania, Turkey and Serbia (33.2 %, 33.1 % and 33.0 %, respectively). Kosovo and Bosnia and Herzegovina reported 29.1 % and 28.4 %, respectively. All these countries reported lower proportions of 30-34 year olds having completed a tertiary level of education than in the EU, where it stood at two fifths (41.0 %) of this subpopulation in 2020.
When comparing to 2010, the highest increase in the proportion of 30-34 year olds who had completed a tertiary level of education was in North Macedonia (+22.6 pp), followed by Albania (+21.8 pp), Kosovo (+19.8 pp between 2012 and 2020), Turkey (+17.6 pp), Bosnia and Herzegovina (16.6 pp), Montenegro (14.3 pp between 2011 and 2020) and Serbia (12.5 pp). In the EU, there was an increase of 8.4 pp between 2010 and 2020.
(% share of persons aged 30-34 years)
Source: Eurostat (edat_lfse_03) and Eurostat data collection
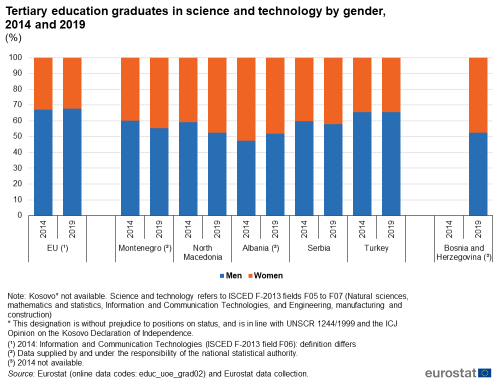
Figure 5 presents the repartition between men and women among tertiary education graduates in science and technology in 2014 and 2019. In almost all candidate countries and potential candidates for which data is available (no data for Kosovo), there were more men than women having graduated from a science or technology discipline both in 2014 and 2019, the only exception being Albania in 2014 where there were more women than men.
In 2019, the lowest share of women having graduated from a science or technology discipline was observed in Turkey, with 34.5 %, which is a similar share as in 2014 (34.7 %). In all the other countries, this share was higher than 40 % in 2019. In Serbia, it was 42.1 % (+1.8 pp compared to 2014); in Montenegro 44.6 % (+4.9 pp compared to 2014); in Bosnia and Herzegovina 47.4 % (no data for 2014); in North Macedonia 47.6 % (+6.7 pp compared to 2014) and in Albania 48.1 % (-4.3 pp compared to 2014).
In comparison, the share of male graduates in 2019 with a science or technology degree was 67.7 % in the EU. This was approximately twice as high as the corresponding share for women (32.3 %). The situation was similar in 2014 (67.0 % for men and 33.0 % for women).
(%)
Source: Eurostat (educ_uoe_grad02) and Eurostat data collection
Source data for tables and graphs
Data sources
Data for the candidate countries and potential candidates are collected for a wide range of indicators each year through a questionnaire that is sent by Eurostat to candidate countries or potential candidates. A network of contacts has been established for updating these questionnaires, generally within the national statistical offices, but potentially including representatives of other data-producing organisations (for example, central banks or government ministries).
The main source of data for the EU aggregate is a joint UNESCO/OECD/Eurostat (UOE) questionnaire on education systems and this is the basis for the core components of the Eurostat database on education statistics; Eurostat also collects data on regional enrolments and foreign language learning. EU data on educational attainment are mainly provided through household surveys, in particular the EU labour force survey (LFS).
Education statistics cover a range of subjects, including: expenditure, personnel, participation and attainment. The standards for international statistics on education are set by three organisations:
- the United Nations Educational, Scientific, and Cultural Organisation (UNESCO) institute for statistics (UIS);
- the Organisation for Economic Cooperation and Development (OECD);
- Eurostat, the statistical office of the European Union (EU).
Tables in this article use the following notation:
| Value in italics | data value is forecasted, provisional or estimated and is therefore likely to change; |
| : | not available, confidential or unreliable value. |
Context
Each EU Member State is responsible for its own education and training systems. As such, EU policy in this area is designed to support national action and address common challenges, by providing a forum for exchanging best practices.
The strategic framework for European cooperation in education and training was adopted by the Council in May 2009, with the following common objectives for 2020:
- Making lifelong learning and mobility a reality
- Improving the quality and efficiency of education and training
- Promoting equity, social cohesion, and active citizenship
- Enhancing creativity and innovation, including entrepreneurship, at all levels of education and training
Based on the mid-term stock-taking of this strategic framework, in 2015 the Council adopted new priority areas and concrete issues for further work up to 2020, as laid down in the Joint Report from the European Commission and the Council on the implementation of the strategic framework (2015/C 417/04):
- Relevant and high-quality knowledge, skills and competences developed throughout lifelong learning, focusing on learning outcomes for employability, innovation, active citizenship and well-being.
- Inclusive education, equality, equity, non-discrimination and the promotion of civic competences.
- Open and innovative education and training, including by fully embracing the digital era.
- Strong support for teachers, trainers, school leaders and other educational staff.
- Transparency and recognition of skills and qualifications to facilitate learning and labour mobility.
- Sustainable investment, quality and efficiency of education and training systems.
In 2021, a new ‘Strategic framework for European cooperation in education and training towards the European Education Area and beyond (2021-2030)’ was adopted by Council Resolution 2021/C 66/01. This sets the following strategic priorities:
- Improving quality, equity, inclusion and success for all in education and training.
- Making lifelong learning and mobility a reality for all.
- Enhancing competences and motivation in the education profession.
- Reinforcing European higher education.
- Supporting the green and digital transitions in and through education and training.
More information concerning the current statistical legislation on education and training statistics can be found here.
While basic principles and institutional frameworks for producing statistics are already in place, the candidate countries and potential candidates are expected to increase progressively the volume and quality of their data and to transmit these data to Eurostat in the context of the EU enlargement process. EU standards in the field of statistics require the existence of a statistical infrastructure based on principles such as professional independence, impartiality, relevance, confidentiality of individual data and easy access to official statistics; they cover methodology, classifications and standards for production.
Eurostat has the responsibility to ensure that statistical production of the candidate countries and potential candidates complies with the EU acquis in the field of statistics. To do so, Eurostat supports the national statistical offices and other producers of official statistics through a range of initiatives, such as pilot surveys, training courses, traineeships, study visits, workshops and seminars, and participation in meetings within the European Statistical System (ESS). The ultimate goal is the provision of harmonised, high-quality data that conforms to European and international standards.
Additional information on statistical cooperation with the candidate countries and potential candidates is provided here.
Notes
* This designation is without prejudice to positions on status, and is in line with UNSCR 1244/1999 and the ICJ Opinion on the Kosovo Declaration of Independence.
Direct access to
Other articles
- All articles on non-EU countries
- Enlargement countries — statistical overview — online publication
- Statistical cooperation — online publication
- All articles on education and training
- Education and training in the EU - facts and figures — online publication
- Quality of life indicators - education — online publication
Publications
- Statistical books/pocketbooks
- Key figures on enlargement countries — 2019 edition
- Key figures on enlargement countries — 2017 edition
- Key figures on the enlargement countries — 2014 edition
- Factsheets
- Basic figures on enlargement countries — Factsheets — 2021 edition
- Leaflets
- Basic figures on enlargement countries — 2020 edition
- Basic figures on enlargement countries — 2019 edition
- Basic figures on enlargement countries — 2018 edition
- Basic figures on enlargement countries — 2016 edition
- Enlargement countries — Demographic statistics — 2015 edition
- Key figures on the enlargement countries — Population and social conditions — 2013 edition
Database
- Participation in education and training (educ_part)
- Pupils and students - enrolments (educ_uoe_enr)
- Education and training outcomes (educ_outc)
- Educational attainment level (edat)
- Population by educational attainment level (edat1)
- Transition from education to work (edatt)
- Early leavers from education and training (edatt1)
- Educational attainment level (edat)
- Education administrative data until 2012 (ISCED 1997) (educ_uoe_h)
- Education indicators - non-finance (educ_indic)
- Distribution of pupils/ students by level (educ_ilev)
- Tertiary education graduates (educ_itertc)
- Enrolments, graduates, entrants, personnel and language learning (educ_isced97)
- Students by ISCED level, age and sex (educ_enrl1tl)
- Education indicators - non-finance (educ_indic)
Dedicated section
Methodology
- Education administrative data from 2013 onwards (ISCED 2011) (ESMS metadata file — educ_uoe_enr_esms)
- Strategic framework for European cooperation in education and training (COM(2008) 865 final)
- Joint Report from the European Commission and the Council on the implementation of the strategic framework (2015/C 417/04)
- Strategic framework for European cooperation in education and training towards the European Education Area and beyond (2021-2030)’ (Council Resolution 2021/C 66/01)
External links
- Directorate-General for European Neighbourhood Policy and Enlargement Negotiations
- Directorate-General for Education and Training
- Education, training and youth
- Strategic framework for European cooperation in education and training (ET 2020)
- Education and Training Monitor – annual publication on national education and training systems in the EU
- Erasmus+