Archive:Early childhood and primary education statistics
Data extracted in September 2020.
Planned article update: October 2021.
Highlights
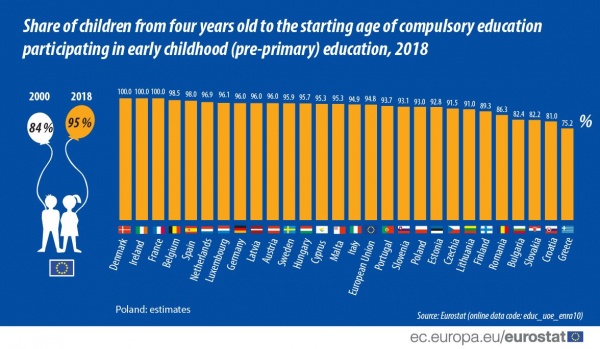
In the EU-27, 94.8 % of children aged between four and the compulsory starting age for primary education were in early childhood education in 2018.
In 2018, there were, on average, 13.6 pupils per teacher in primary education across the EU-27, ranging from an average of 9.0 in Luxembourg to 19.5 in Romania.
In 2017, public expenditure on primary education relative to GDP ranged from 0.4 % in Romania and 0.6 % in Germany up to 1.9 % in Cyprus, Sweden and Denmark.
(%)
Source: Eurostat (educ_uoe_enra10)
This article presents statistics on early childhood and primary education (ISCED levels 0 and 1) in the European Union (EU) and forms part of an online publication on education and training in the EU.
School helps young people acquire basic life skills and competences that are necessary for their personal development. The quality of a pupil’s school experience affects not only their development, but also their place in society, level of educational attainment, and employment opportunities. Early childhood and primary education are important to prepare pupils for the secondary level of their education.
The quality of education may be linked to teaching standards, which in turn are related to the demands placed upon teachers, the training they receive, the roles they are asked to fill and the resources that are made available for them to carry out their tasks. Equally, the quality of education may show local or regional variations, related to a variety of socio-demographic factors.
Full article
Participation
The number of students found in each of the earliest levels of education varies somewhat between the EU Member States. This reflects, to some degree, the demographic structure of each population and also country-specific policies relating to the provision of early childhood development and pre-primary education, as well as differences in the age at which children should start their compulsory formal education.
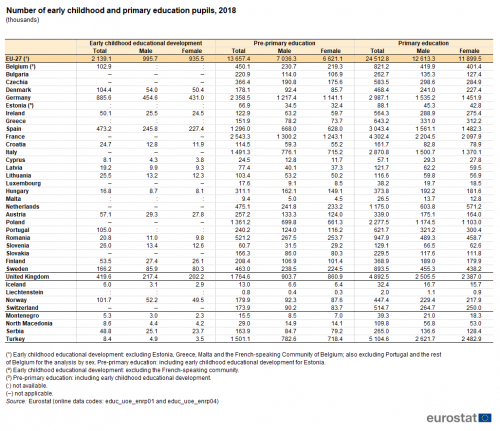
In the EU-27 there were 13.7 million pupils in pre-primary education in 2018. The number of pupils in primary education was 1.8 times as high, at 24.5 million.
(thousands)
Source: Eurostat (educ_uoe_enrp01) and (educ_uoe_enrp04)
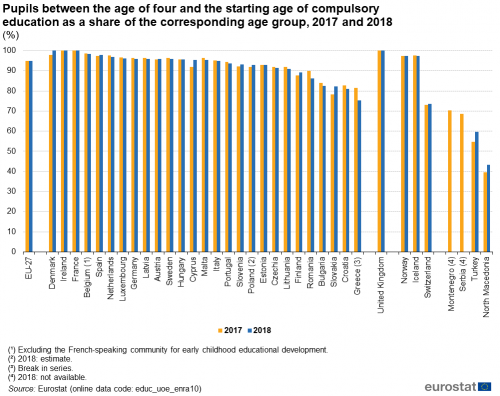
The strategic framework for European cooperation in education and training 2020 (ET 2020), adopted in May 2009, set a benchmark to be achieved (across the whole of the EU) by 2020, that at least 95 % of children between the age of four and the age for starting compulsory primary education should participate in early childhood education. This target was almost reached in 2016 and 2017, as the share of children in the EU-27 between the age of four and the starting age of compulsory education — which varies between four and seven depending on the EU Member State under consideration — attending school was 94.9 % (see Figure 1); it fell marginally to 94.8 % in 2018. An analysis by EU Member State for 2018 reveals that at the lower end of the range this ratio was 75.2 % in Greece (note that there is a break in series) and was between 80.0 % and 90.0 % in Croatia, Slovakia, Bulgaria, Romania and Finland. A total of 14 EU Member States reported that their rate was already above the 95 % benchmark in 2018: Malta, Cyprus, Hungary, Sweden, Austria, Latvia, Germany, Luxembourg, the Netherlands, Spain, Belgium, France, Ireland and Denmark — the last three each reporting ratios of 100 %.
(%)
Source: Eurostat (educ_uoe_enra10)
Number of teachers and pupil-teacher ratios
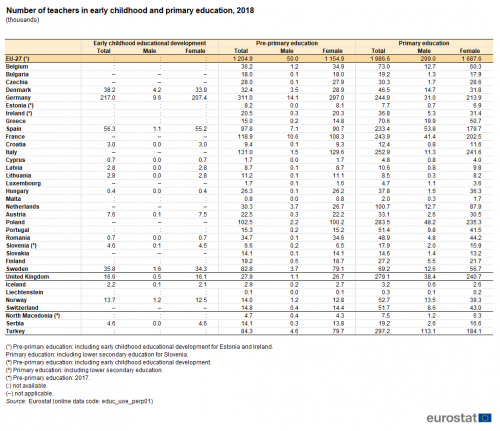
In pre-primary and primary education levels, there is a clear dominance of female over male teachers. Among the 12 EU Member States for which the number of teachers in early childhood development in 2018 is available (see Table 2 for more details of coverage), the share of men in the total number of teachers ranged from less than 1.0 % in Lithuania, Cyprus, Romania, Croatia and Latvia to 4.4 % in both Germany and Sweden, with Denmark (11.1 %) the only Member State to record a double-digit share.
(thousands)
Source: Eurostat (educ_uoe_perp01)
There were 1.2 million pre-primary school teachers in the EU-27 (including early childhood educational development for Estonia and Ireland) in 2018 and 2.0 million primary school teachers (including lower secondary education for Slovenia). Unlike their pupils, there was a large gender imbalance among teachers at these educational levels: men accounted for just 4.2 % of all pre-primary school teachers in the EU and for 15.1 % of primary school teachers. As such, the share of male teachers in the total number of teachers was seen to rise as a function of the educational level in which they were teaching.
The number of pre-primary school teachers in 2018 reached 311 000 in Germany, which was more than twice the level recorded in any of the other EU Member States; Italy (131 000), France (119 000) and Poland (102 000) were the only other Member States to record a count of at least 100 000.
An analysis by sex reveals that the Netherlands and Denmark were the only EU Member States in 2018 to report a share of male teachers in the total number of pre-primary teachers which surpassed 10.0 %, while 1.0 % or fewer of all pre-primary school teachers were men in 11 of the 27 Member States (note that data for Estonia and Ireland include early childhood educational development).
Among primary school teachers, the share of male teachers also remained well below one third, but was systematically higher than the corresponding share recorded for pre-primary education. In Lithuania, Hungary and Italy, fewer than 5.0 % of primary school teachers were men in 2018, whereas in Finland, Spain and Luxembourg the share of male teachers was between one fifth and one quarter; this share was 28.2 % in Greece and peaked at 31.6 % in Denmark.
One measure which may be used to analyse the quality of schooling is the pupil-teacher ratio, which provides an indication of the average number of pupils there are for each teacher (see Table 3). In 2018, pupil-teacher ratios were relatively low — which may generally be considered to be beneficial — in a majority of the EU Member States for early childhood educational development (subject to data availability); this may be linked to the specific needs of very young children. For example, Denmark, Germany, Sweden, Slovenia, Latvia, Croatia, Austria and Spain each had ratios that were less than 10.0 pupils per teacher for early childhood educational development. However, this level of education did not systematically record the lowest pupil-teacher ratios (among those Member States for which data are available for all three levels of education as shown in Table 3), with lower ratios reported in Hungary and Romania for pre-primary and for primary education.
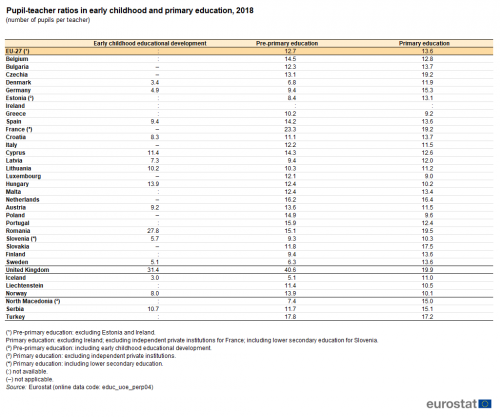
(number of pupils per teacher)
Source: Eurostat (educ_uoe_perp04)
In 2018, the pupil-teacher ratio for pre-primary education ranged among the EU Member States (no data for Ireland) from a low of 6.3 in Sweden up to 16.2 pupils per teacher in the Netherlands, with France (23.3) recording by far the highest ratio; Iceland reported a lower pupil-teacher ratio for pre-primary education (5.1) than any of the Member States, while the United Kingdom reported a higher one (40.6).
A comparison between pupil-teacher ratios for pre-primary education and primary education shows that there was no clear pattern (see Figure 2) insofar as 15 out of the 26 EU Member States for which data are available (no data for Ireland) recorded a lower ratio for pre-primary education.
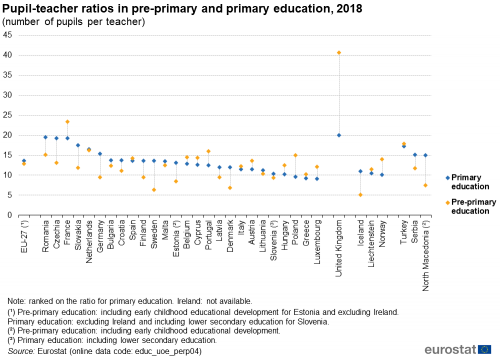
(number of pupils per teacher)
Source: Eurostat (educ_uoe_perp04)
In 2018, the lowest pupil-teacher ratios for primary education were recorded in Luxembourg, Greece and Poland, each with a ratio of 9.0-9.6 pupils per teacher; these were the only EU Member States to report a ratio in single-digits. At the other end of the range, the highest pupil-teacher ratios for primary education (close to 20 pupils per teacher) were reported in France, Czechia and Romania. As such, France recorded the highest ratio for pre-primary education and the joint second highest ratio for primary education.
Finance
Data on expenditure for education are compiled for financial years, rather than for academic years as is used for example for statistics on pupil enrolments. The proportion of financial resources devoted to education by the public sector may be measured by public expenditure on various levels of education relative to gross domestic product (GDP). In the EU-27, public expenditure on pre-primary education relative to GDP stood at 0.6 %, while the ratio for primary education was almost twice as high, at 1.1 % (see Figure 3 for details of coverage).
Among the EU Member States, public expenditure on pre-primary education ranged in 2017 from less than one third of a per cent Greece, Romania and Cyprus up to 0.9 % in Bulgaria and 1.2 % in Sweden. A similar comparison for primary education shows a generally higher level of expenditure with a range from 0.4 % in Romania and 0.6 % in Germany up to a peak of 1.9 % in Cyprus, Sweden and Denmark.
Bulgaria and Hungary were the only EU Member States (subject to data availability) where public expenditure on pre-primary education was higher than public expenditure on primary education in 2017. By contrast, in Cyprus, the level of public expenditure on primary education (1.9 % relative to GDP) was nearly six times as high as that on pre-primary education. The ratio of expenditure on primary education to expenditure on pre-primary education was also relatively high in Greece (nearly five times as high) and Portugal (nearly four times as high). Some of these differences may be explained by different entry ages for primary education.
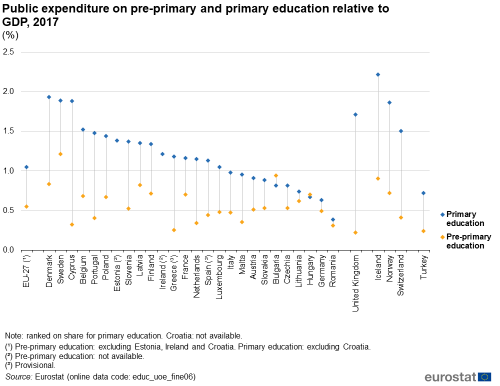
(%)
Source: Eurostat (educ_uoe_fine06)
Source data for tables and graphs
![]() Early childhood and primary education statistics: tables and figures
Early childhood and primary education statistics: tables and figures
Data sources
Source
The standards for international statistics on education are set by three international organisations:
- the United Nations Educational, Scientific, and Cultural Organization (UNESCO) institute for statistics (UIS);
- the Organisation for Economic Cooperation and Development (OECD);
- Eurostat, the statistical office of the EU.
The source of data used in this article is a joint UNESCO/OECD/Eurostat (UOE) data collection on education statistics and this is the basis for the core components of Eurostat’s database on education statistics; in combination with the joint data collection Eurostat also collects data on regional enrolments and foreign language learning.
Regulation (EC) No 452/2008 of 23 April 2008 provides the legal basis for the production and development of EU statistics on education and lifelong learning. Two European Commission Regulations have been adopted concerning the implementation of the education and training data collection exercises. The first, Commission Regulation (EU) No 88/2011 of 2 February 2011, concerned data for the school years 2010/2011 and 2011/2012, while the second, Commission Regulation (EU) No 912/2013 of 23 September 2013, concerns data for school years from 2012/2013 onwards.
More information about the joint data collection is available in an article on the UOE methodology.
Classification
The international standard classification of education (ISCED) is the basis for international education statistics, describing different levels of education; it was first developed in 1976 by UNESCO and revised in 1997 and again in 2011. ISCED 2011 distinguishes nine levels of education: early childhood education (level 0, with level 01 for early childhood development and level 02 for pre-primary education); primary education (level 1); lower secondary education (level 2); upper secondary education (level 3); post-secondary non-tertiary education (level 4); short-cycle tertiary education (level 5); bachelor’s or equivalent (level 6); master’s or equivalent (level 7); doctoral or equivalent (level 8). The first results based on ISCED 2011 were published in 2015 starting with data for the 2013 reference period for statistics on pupils and teachers and the 2012 reference period for statistics on expenditure. This classification forms the basis of all of the statistical information that is presented in this article.
Early childhood education programmes are typically designed with a holistic approach to support children’s early cognitive, physical, social and emotional development and introduce young children to organised instruction outside of the family context. These programmes have an intentional education component and aim to develop socio-emotional skills necessary for participation in school and society. They also develop some of the skills needed for academic readiness and prepare children for entry into primary education. Such programmes target children below the compulsory age of entry into primary education.
Early childhood educational development (ISCED level 01) has educational content designed for younger children (in the age range of 0 to 2 years), whilst pre-primary education (ISCED level 02) is designed for children from the age of 3 years up to the start of primary education (ISCED level 1). Age is generally the sole criterion for admission to compulsory primary education, which starts when children reach six years of age in most of the EU Member States, although Bulgaria, the Baltic Member States, Croatia, Poland, Finland and Sweden have a compulsory starting age of seven, while Malta (five years) has a younger starting age. More information about the starting age of compulsory primary education is provided under point 6.3.1 of the national quality reports (national metadata) attached to the metadata for education administrative data. Note that in approximately half of the Member States it is also compulsory for young children to attend pre-primary education (usually at the age of 5).
Primary education typically lasts six years, although its duration can range between four and seven years; as a result, it typically lasts until a child is 10-12 years old. Primary education programmes are typically designed to provide students with fundamental skills in reading, writing and mathematics (in other words literacy and numeracy) and to establish a solid foundation for learning and understanding core areas of knowledge, personal and social development, in preparation for lower secondary education. It focuses on learning at a basic level of complexity with little, if any, specialisation.
Key concepts
The indicator for the share of pupils between the age of four and the starting age of compulsory education relative to the corresponding age group reflects participation rates (from the age of four) in early childhood education, in other words in early childhood development (ISCED level 01) or pre-primary education (ISCED level 02). The upper boundary to the age range that is covered varies between EU Member States as the starting age for compulsory education varies between countries (see above).
Pupil-teacher ratios are calculated by dividing the number of full-time equivalent pupils and students in each level of education by the number of full-time equivalent teachers at the same level; this ratio should not be confused with average class size, which refers to the number of students in a given course or classroom.
Context
In February 2011, the European Commission adopted a Communication Early childhood education and care: providing all our children with the best start for the world of tomorrow (COM(2011) 66 final). This noted that early childhood education and care is an essential foundation for successful lifelong learning, social integration, personal development and later employability and that it is particularly beneficial for disadvantaged children, with the potential to help lift children out of poverty and family dysfunction.
In 2018, the European Commission made a Proposal for a Council recommendation on high-quality early childhood education and care systems (COM(2018) 271 final), with the objective of:
- developing a common understanding across the EU of what constitutes good quality service provision with regard to early childhood education and care;
- supporting EU Member States in their efforts to improve access to and the quality of their early childhood education and care systems.
The Recommendation was adopted on 22 May 2019.
ET 2020 strategic framework
The updated strategic framework for European cooperation in education and training (known as ET 2020), was adopted by the Council in May 2009. It sets out four strategic objectives for education and training in the EU:
- making lifelong learning and mobility a reality;
- improving the quality and efficiency of education and training;
- promoting equality, social cohesion and active citizenship; and
- enhancing creativity and innovation (including entrepreneurship) at all levels of education and training.
The strategy sets a number of benchmarks to be achieved by 2020, including that at least 95 % of children between the age of four and the age for starting compulsory primary education should participate in early childhood education; this benchmark was almost reached, for the EU-27 as a whole, in 2016 (94.9 %).
An ET 2020 working group on early childhood education and care was created in July 2018 (and ran through to June 2020). It brought together national representatives of the relevant ministries and European organisations interested in the topic to advance discussions on quality early childhood education and care, with a special focus on inclusion and staff development.
Direct access to
- Participation in education and training (educ_part)
- Education personnel (educ_uoe_per)
- Education finance (educ_uoe_fin)
Metadata
- Education administrative data from 2013 onwards (ISCED 2011) (ESMS metadata file — educ_uoe_enr_esms)
Manuals and other methodological information
- Classification of learning activities — Manual — 2016 edition
- International Standard Classification of Education (ISCED)
- ISCED 2011 operational manual — Guidelines for classifying national education programmes and related qualifications
- UOE data collection on formal education — Manual on concepts, definitions and classifications — 2019 edition
- Regulation (EC) No 452/2008 of 23 April 2008 concerning the production and development of statistics on education and lifelong learning
- From school year 2012/2013 onwards: Commission Regulation (EU) No 912/2013 of 23 September 2013 as regards statistics on education and training systems
- School years 2010/2011 and 2011/2012: Commission Regulation (EU) No 88/2011 of 2 February 2011 as regards statistics on education and training systems
- Summaries of EU Legislation: Statistics on education and lifelong learning
- European Commission — Education and training monitor
- European Commission — Education and training — Early childhood education and care
- European Commission — Education and training — Strategic framework for education and training
- Eurydice — Better knowledge for better education policies
- Key data on early childhood and care in Europe — Eurydice — 2019 edition
- OECD — Early childhood and schools
- UNESCO — Early childhood care and education
- UNESCO — Education transforms lives