Archive:Main differences between older and younger people on the EU labour market - statistics
Data extracted in Month YYYY
Planned article update: Month YYYY
Highlights
Tweet Text
Tweet Text
Introduction text
Full article
Focus on gender
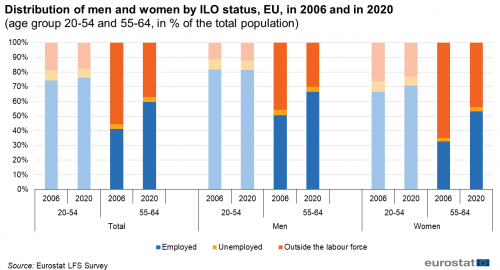
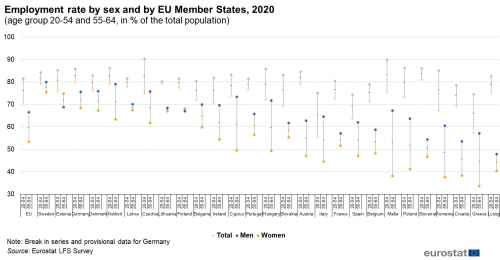
Data shows that the gender employment gap among the age group 20 - 54, (the difference between the employment rates of men and women), stood at 11.7 percentage points (p.p.) in 2020 – while men had an employment rate of 80.9 %, the figure for women was just 69.2 %. For the age group of 55 - 65, the gender employment gap stood at 12.9 % in 2020 – while men had an employment rate of 66.1 %, women only had a figure of 53.2 %. When we compare age groups, the difference between men in employment is lower than women (14.8 p.p. for men and 16.0 p.p. for women).
With regard to the unemployed, the difference between men and women in the group 20-54 is rather small, only 0.2 p.p. in favour of men. The difference between men and women will also be small 0.8 p.p. in favour of men when we talk about a 55-65 age group.
The gap between men and women of an age group of 20 to 54 years is 11.9 p.p. in favour of women in the group of the inactive population. And in the 55–65-year age group, the difference was 1.8 p.p. higher, 13.7 p.p. in favour of women in the group of the inactive population.
The percentage of employed men versus employed women in the employed population was 17.8 % in favour of men. In 2006, the indicator of employed men was 58.9 %, while women were 41.1 %. In 2020, the situation had improved, and the employment gap between men and women was only 8% (54.0 % for men and 46.0 % for women).
When it comes to the unemployed, men dominated the market in both 2006 and 2020. Unemployment among men was 19.0 % higher than among women in 2006. This figure dropped to 8.8 % in 2020.
For the inactive population, the difference between 2006 and 2020 has remained almost unchanged.
Focus on education
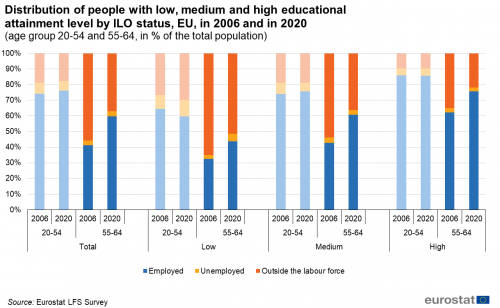
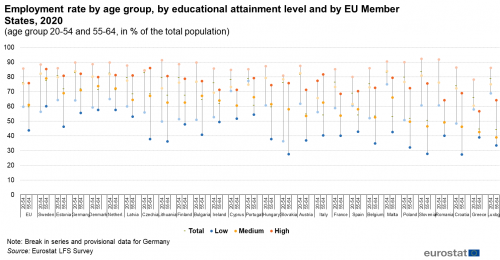
In 2020 for both age groups (20 – 54 and 55-65) having higher level of education will lead to higher employability. When comparing the age group of 55-64 with a high education to the same age group with a low education, the chances of employment are higher for 30.5 %. With the same parameters, the chances of employment are higher for 25.3 % of those aged 20 to 54. When it comes to different education levels and employment rates, younger and older people with low education levels will have a 14.9 % difference, people with medium education levels will have a 14.1 % difference, and people with high education levels will have a 9.7 % difference. As a result, having a higher level of education is critical for the older generation to compete successfully with a younger population in order to remain employed. There are also interesting results among younger age group with a low level of education who are employed and older age group with a medium level of education who are employed. The difference between these groups is 1.6 %, which may indicate that older people require a higher level of education to compete with the younger generation. The same trend can be seen among younger age group with a medium level of education who are employed and older age group with a high level of education who are employed. In terms of unemployment, as education levels rise, the rate of unemployment falls sharply; however, in comparison to the younger age group, the difference in unemployment among older people is 0.1 % when medium and higher education levels are compared. The gap between age groups, those with a high education and low education, is also quite considerable when it comes to the inactive population. Younger people with high education are 11.8 % less likely than older people with a similar level of education to remain inactive. While the level of young people with low education is 20.7 % lower than those with the same educational level in old age group. In terms of the people's inactive status, it should be mentioned that being inactive can still mean being involved with education for a younger group, and for an older one, it can be a factor in the retirement early or care for grandchildren.
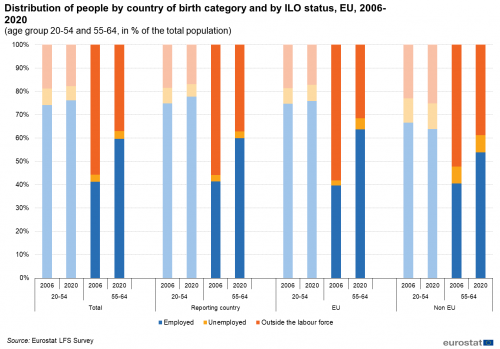
The chart shows that more people began to look for work in 2020 compared to 2006. This is demonstrated, for example, by the fact that the percentage of inactive people, regardless of education level, is much lower in 2020 than it was in 2006. The difference between 2006 and 2020 for inactive people with a low education level is 13.8 %, with 64.6 % in 2006 and 50.8 % in 2020. For inactive people with a medium education level, the difference between 2006 and 2020 is 18.2 %, with 54.4 % in 2006 and 36.2 % in 2020. The difference in inactive people with a high education level between 2006 and 2020 is 13.2 %, with 35.5 % in 2006 and 22.3 % in 2020.
Unemployment has increased in only one sector, and that is among those with a low level of education. This percentage was 2.6 % in 2006 and is 4.8 % in 2020. This could imply that finding a job for a person aged 55 to 64 with a low education level will be more difficult in 2020 than it was in 2006. For people with a medium or high level of education, unemployment has decreased in 2020 compared to 2006. In 2006, the unemployment rate for people with a medium level of education was 3.3 %; by 2020, this rate had dropped to 2.9 %. In 2006, the rate for people with a high level of education was 2.9 %; by 2020, it decreased by 0.1 %. This suggests that for people aged 55 to 64, education level plays a significant role in job search in 2020. This will also be covered in the following paragraph about employed people.
In terms of the employed population, the number of employed people in 2020, regardless of education level, has increased significantly since 2006. Employment rates among people with a low level of education increased by 11.7 % in 2020 compared to 2006, (2006: 32.7 % to 2020: 44.4 %). Among people with a medium level of education, the increase is 18.6 %. In 2006, the figure was 42.3 %, but by 2020, it had risen to 60.9 %. We are also seeing an increase in indicators in the sector of people with a high level of education. The difference is 13.3 % in favour of 2020.
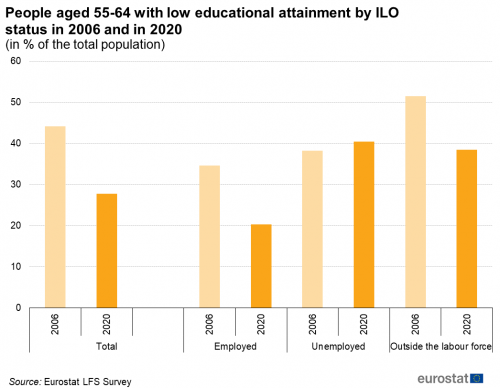
This graph shows that the level of education has increased significantly among people aged 55 to 64. The point of this is demonstrated by data showing that in 2006, 44.9 % of people had a low level of education, but by 2020, this figure has dropped to 29.0 %. The proportion of people with a medium level of education has risen from 38.5 % in 2006 to 47.2 % in 2020. The proportion of people with a high level of education increased by 7.2 % from 16.6 % in 2006 to 23.8 % in 2020.
The number of people with a low level of education has decreased by 14.0 % among the employed population. Also, among employed people, the number of people with a medium and high level of education has increased. (8.8 %; 5.2 % respectively). According to the data presented above, a significantly higher proportion of employed people have a higher level of education in 2020 than in 2006.
The number of people with a medium or high education among those who are inactive has increased (8.5 % and 3.8 %, respectively), which may indicate an early retirement. However, for people with a low education level, this indicator has decreased from 52.0 % in 2006 to 39.7 % in 2020, indicating that more people with a low education may remain in the labour market.
In 2006, the number of men with a low level of education was much lower compared to women with a low level of education: 42.8 % for men and 57.2 % for women. By 2020, the number of women with low education began to fall, while the number of men with low education began to grow, and this difference was 7.6 % (46.2 % for men and 53.8 % for women) comparing to 14.4 % in 2006.
In terms of people with a medium level of education, men accounted for 51.2 % and women accounted for 48.8 % in 2006, but by 2020, the situation had shifted almost opposite, with women taking the lead.
The most interesting sector is the sector for people with a high level of education. In 2006, men with a high level of education accounted for 56.8 %, while women accounted for only 43.2 %. By 2020, the situation had drastically changed, with men accounting for 49.8 % and women accounting for 50.2 %.
Focus on country of birth
Source data for tables and graphs
Data sources
<description of data sources, survey and data availability (completeness, recency) and limitations>
Context
<context of data collection and statistical results: policy background, uses of data>
Direct access to
Main tables
- Title(s) of second level folder (if any)
- Title(s) of third level folder (if any)
Database
- Title(s) of second level folder (if any)
- Title(s) of third level folder (if any)
Dedicated section
Publications
Publications in Statistics Explained (either online publications or Statistical articles) should be in 'See also' above
Methodology
<link to ESMS file, methodological publications, survey manuals, etc.>
- Crime and criminal justice (ESMS metadata file — crim_esms)
- Title of the publication
Legislation
- Use Eur-Lex icon on the ribbon tool at the top of the statistical article to enter the year and reference of your regulation or directive.
- See example of what should be issued hereafter
- Regulation (EU) No 1013/2016
Visualisations
- Regional Statistics Illustrated - select statistical domain 'xxx' (= Agriculture, Economy, Education, Health, Information society, Labour market, Population, Science and technology, Tourism or Transport) (top right)
External links
Notes
<footnote text will be automatically inserted if reference tags are used in article content text (use reference icon on ribbon)>
[[Category:<Subtheme category name(s)>|Name of the statistical article]] [[Category:<Statistical article>|Name of the statistical article]]
