Archive:SDG 6 - Clean water and sanitation (statistical annex)
Ensure availability and sustainable management of water and sanitation for all (statistical annex)
Data extracted in May 2021.
Planned article update: June 2022.
Highlights

This article provides an overview of statistical data on SDG 6 ‘Clean water and sanitation’ in the European Union (EU). It is based on the set of EU SDG indicators for monitoring of progress towards the UN Sustainable Development Goals (SDGs) in an EU context.
This article is part of a set of statistical articles, which are based on the Eurostat publication ’Sustainable development in the European Union — Monitoring report on progress towards the SDGS in an EU context — 2021 edition’. This report is the fifth edition of Eurostat’s series of monitoring reports on sustainable development, which provide a quantitative assessment of progress of the EU towards the SDGs in an EU context.
Full article
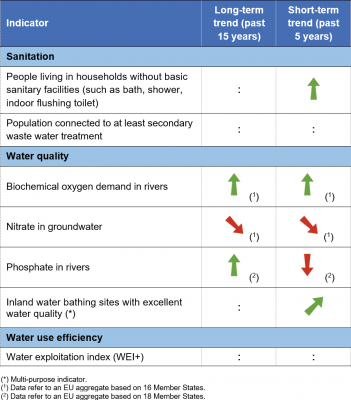
Table 1: Indicators measuring progress towards SDG 6, EU
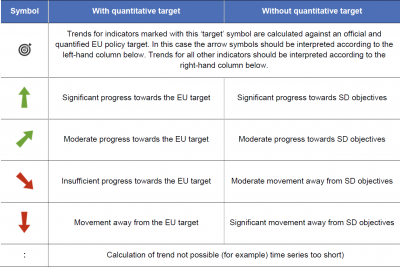
Table 2: Explanation of symbols for indicating progress towards SD objectives and targets


People living in households without basic sanitary facilities (such as bath, shower, indoor flushing toilet)

This indicator reflects the share of total population having neither a bath, nor a shower, nor an indoor flushing toilet in their household. Data presented in this section stem from the EU Statistics on Income and Living Conditions (EU-SILC).
.png)
Compound annual growth rate (CAGR) for the total rate: – 7.0 % per year in the period 2014–2019.
Source: Eurostat (sdg_06_10)
Source: Eurostat (sdg_06_10)
Population connected to at least secondary wastewater treatment

This indicator measures the percentage of the population connected to waste water treatment systems with at least secondary treatment. Thereby, waste water from urban or other sources is treated by a process generally involving biological treatment with a secondary settlement or other process that removes organic material and reduces its biochemical oxygen demand (BOD) by at least 70 % and chemical oxygen demand (COD) by at least 75 %. Data presented in this section stem from the Water Statistics of the European Statistical System (ESS).
.png)
Source: Eurostat (sdg_06_20)
Biochemical oxygen demand in rivers

This indicator measures the mean annual five-day biochemical oxygen demand (BOD5) in rivers, weighted by the number of measuring stations. BOD5 is a measure of the amount of oxygen that aerobic microorganisms need to decompose organic substances in a water sample over a five-day period in the dark at 20 °C. High BOD5 values are usually a sign of organic pollution, which affects water quality and aquatic environment. Organic pollution caused by discharges from waste water treatment plants, industrial effluents and agricultural run-off increase concentrations of this parameter. The cleanest rivers have a five-day BOD of less than 1 milligram per litre (mg/L). Moderately polluted rivers show values ranging from 2 to 8 mg/L. Data presented in this section stem from the EEA Waterbase database on the status and quality of Europe's rivers.
.png)
Compound annual growth rate (CAGR) for the total rate: – 2.4 % per year in the period 2003–2018; – 1.4 % per year in the period 2013–2018.
Source: EEA (Eurostat (sdg_06_30))
.png)
Source: EEA (Eurostat (sdg_06_30))
Nitrate in groundwater

This indicator refers to concentrations of nitrate (NO3) in groundwater measured as milligrams per litre (mg NO3/L). Data are taken from well samples and aggregated to annual average concentrations for groundwater bodies in Europe. Only complete series after inter/extrapolation are included. The indicator is relatively robust in presenting the overall trend in water quality, however, the distribution of measuring stations over groundwater bodies might mask exceedances of nitrate levels in certain polluted areas. The data stem from the EEA Waterbase database on the status and quality of Europe's rivers.
.png)
Compound annual growth rate (CAGR) for the total rate: 0.3 % per year in the period 2003–2018; 0.9 % per year in the period 2013–2018.
Source: EEA (Eurostat (sdg_06_40))
.png)
Source: EEA (Eurostat (sdg_06_40))
.png)
.png.png)
Phosphate in rivers

This indicator measures the concentration of phosphate (PO4) per litre in the dissolved phase from water samples from river stations and aggregated to annual average values. At high concentrations phosphate can cause water quality problems, such as eutrophication, by triggering the growth of aquatic plants including algae. The data stem from the EEA Waterbase database on the status and quality of Europe's rivers.
.png)
Compound annual growth rate (CAGR) for the total rate: – 2.2 % per year in the period 2003–2018; 1.4 % per year in the period 2013–2018.
Source: EEA (Eurostat (sdg_06_50))
.png)
Source: EEA (Eurostat (sdg_06_50))
Water exploitation index (WEI+)
The regionalised water exploitation index (WEI+) measures total fresh water use as a percentage of the long-term annual average available water (LTAA) from renewable fresh water resources (groundwater and surface water) at a given time and place. It quantifies how much water is abstracted and how much is returned after use to the environment via basins. The difference between water abstraction and return is regarded as water consumption, and in combination with LTAA, illustrates the pressure on renewable freshwater resources due to water abstraction. In the absence of Europe-wide agreed formal targets, values above 20 % are generally considered to be a sign of water scarcity, while values equal or greater than 40 % indicate situations of severe water scarcity [1], meaning the use of freshwater resources is unsustainable. Annual calculations of the WEI+ at national level do not reflect uneven spatial and seasonal distribution of resources and may therefore mask water stress which occurs on a seasonal or regional basis. The indicator is a result of data modelling by the EEA based on data from the WISE SoE-Water quantity database (WISE 3) and other open sources (JRC, Eurostat, OECD, FAO) and including gap filling methods.
,_EU,_2000-2017_(%25_of_renewable_water_resources).png)
Source: EEA (Eurostat (sdg_06_60))
,_by_country,_2012_and_2017_(%25_of_renewable_water_resources).png)
Source: EEA (Eurostat (sdg_06_60))
Direct access to
Notes
- ↑ European Environment Agency (2020), Use of freshwater resources in Europe.