Archive:Weekly absences from work
Data extracted in July 2020
Planned article update: October 2020
Highlights
Tweet Text
Tweet Text
<Interactive graph to be set by unit B4:>
or
or
To respond to the need for a more thorough analysis of the labour market in the situation of recent COVID-19 pandemic, Eurostat developed new experimental indicator - “Weekly absences from work”.
The following article is focused on weekly absences from work and complements the article “Absences from work - quarterly statistics”, part of the publication “Labour market in the light of COVID-19 pandemic”.
Full article
Weekly absences over the years
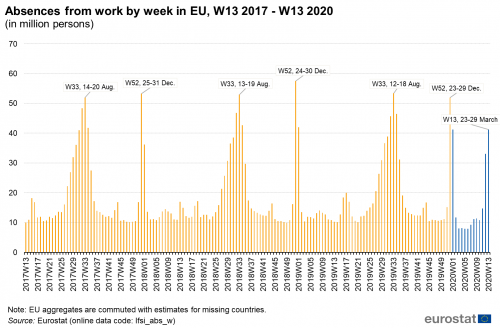
As shown in Figure 1, weekly absences from work in EU usually have peaks of over 50 million in the 33rd and 52nd week of the year, corresponding to mid-august and late December. However, from the second week of March (11th since the beginning of 2020), associated with the first confinement measures against the spread of COVID-19 pandemic taken by the governments, weekly absences sharply increased. People absent from work were 10.8 million at the beginning of March (10th week, 2020), their number increased to 14.7 million in the week after, and doubled its size in mid-March (12th week, 2020) when reached 33.1 million. At the last week of the month (13th week, 2020) weekly absences from work amounted for almost 80 % of the last year’s peaks from mid-august and late December and reached 41.2 million.

Source: Eurostat (lfsi_abs_w)
Figure 2 compares absences from work in EU in the first 13 weeks of 2020 to the average of the corresponding weeks in the period 2015-2019. It is visible that the amount of weekly absences in January and February 2020 (weeks 1 to 10, 2020) is very similar, or even smaller, compared to the previous years. However, last three weeks of March 2020 (weeks 11 to 13, 2020) differentiate significantly. Absences from work in the 11th week of 2020 were with one-third (35.7 %) more compared to the average of the same period for the previous five years. In the following two weeks, absences tripled this average. In weeks 12 and 13 of 2020 (mid to late March), people absent from work were respectively with 21.4 and 28.5 million more, compared to the previous years.

Source: Eurostat (lfsi_abs_w)
</sesection>
Title
Text
Source data for tables and graphs
Data sources
<description of data sources, survey and data availability (completeness, recency) and limitations>
Context
<context of data collection and statistical results: policy background, uses of data>
Direct access to
Main tables
- Title(s) of second level folder (if any)
- Title(s) of third level folder (if any)
Database
- Title(s) of second level folder (if any)
- Title(s) of third level folder (if any)
Dedicated section
Publications
Publications in Statistics Explained (either online publications or Statistical articles) should be in 'See also' above
Methodology
<link to ESMS file, methodological publications, survey manuals, etc.>
- Crime and criminal justice (ESMS metadata file — crim_esms)
- Title of the publication
Legislation
- Use Eur-Lex icon on the ribbon tool at the top of the statistical article to enter the year and reference of your regulation or directive.
- See example of what should be issued hereafter
- Regulation (EU) No 1013/2016
Visualisations
- Regional Statistics Illustrated - select statistical domain 'xxx' (= Agriculture, Economy, Education, Health, Information society, Labour market, Population, Science and technology, Tourism or Transport) (top right)
External links
Notes
<footnote text will be automatically inserted if reference tags are used in article content text (use reference icon on ribbon)>
[[Category:<Subtheme category name(s)>|Name of the statistical article]] [[Category:<Statistical article>|Name of the statistical article]]
Delete [[Category:Model|]] below (and this line as well) before saving!