Archive:SDG 6 - Clean water and sanitation (statistical annex)
Ensure availability and sustainable management of water and sanitation for all (statistical annex)
Data extracted in May 2019.
Planned article update: June 2020.
Highlights

This article provides an overview of statistical data on SDG 6 ‘Clean water and sanitation’ in the European Union (EU). It is based on the set of EU SDG indicators for monitoring of progress towards the UN Sustainable Development Goals (SDGs) in an EU context.
This article is part of a set of statistical articles, which are based on the Eurostat publication ’Sustainable development in the European Union — Monitoring report - 2019 edition’. This report is the third edition of Eurostat’s series of monitoring reports on sustainable development, which provide a quantitative assessment of progress of the EU towards the SDGs in an EU context.
Full article
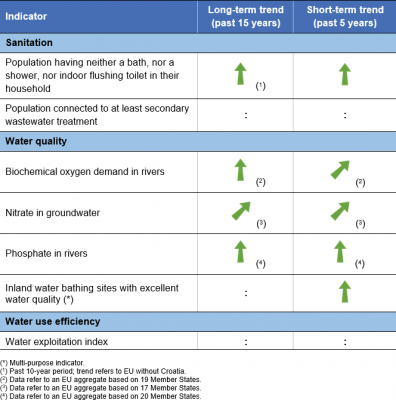
Table 1: Indicators measuring progress towards SDG 6, EU-28

Table 2: Explanation of symbols for indicating progress towards SD objectives and targets


Population having neither a bath, nor a shower, nor indoor flushing toilet in their household

This indicator reflects the share of total population having neither a bath, nor a shower, nor an indoor flushing toilet in their household. Data presented in this section stem from the EU Statistics on Income and Living Conditions (EU-SILC).
.png)
Source: Eurostat (sdg_06_10)
_of_the_share_of_population_having_neither_a_bath,_nor_a_shower,_nor_indoor_flushing_toilet_in_their_household,_EU,_2019.png)
Source: Eurostat (sdg_06_10)
.png)
Source: Eurostat (sdg_06_10)
Population connected to at least secondary wastewater treatment

This indicator measures the percentage of the population connected to wastewater treatment systems with at least secondary treatment. Thereby, wastewater from urban sources or elsewhere is treated by a process generally involving biological treatment with a secondary settlement or other process, resulting in the removal of organic material that reduces the biochemical oxygen demand (BOD) by at least 70 % and the chemical oxygen demand (COD) by at least 75 %. Data presented in this section stem from the Water Statistics of the European Statistical System (ESS).
.png)
Source: Eurostat (sdg_06_20)
Biochemical oxygen demand in rivers

This indicator measures the mean annual BOD5 in rivers, weighted by the number of measuring stations. BOD5 is a measure of the amount of oxygen that aerobic microorganisms need to decompose organic substances in a water sample over a five-day period in the dark at 20 °C. High BOD5 values are usually a sign of organic pollution, which affects water quality. The cleanest rivers have a five-day BOD of less than 1 mg/L. Moderately polluted rivers show values ranging from 2 to 8 mg/L. Data presented in this section stem from the EEA Waterbase database on the status and quality of Europe's rivers.
.png)
Source: EEA (sdg_06_30)
_of_the_biochemical_oxygen_demand_in_rivers,_EU,_2019.png)
Source: EEA (sdg_06_30)
.png)
Source: EEA (sdg_06_30)
Nitrate in groundwater

This indicator refers to concentrations of nitrate (NO3) in groundwater measured as milligrams per litre (mg/L). Data are taken from well samples and aggregated to annual average concentrations for groundwater bodies in Europe. Only complete series after inter/extrapolation are included. The data stem from the EEA Waterbase database on the status and quality of Europe's rivers.
.png)
_of_the_nitrate_in_groundwater,_EU,_2019.png)
Source: EEA (sdg_06_40)
.png)
Source: EEA (sdg_06_40)
Phosphate in rivers

This indicator measures the concentration of phosphate (PO4) per litre in the dissolved phase from water samples from river stations and aggregated to annual average values. At high concentrations phosphate can cause water quality problems, such as eutrophication, by triggering the growth of macrophytes and algae. The data stem from the EEA Waterbase database on the status and quality of Europe's rivers.
.png)
_of_the_phosphate_in_rivers,_EU,_2019.png)
.png)
Water exploitation index

This indicator measures the annual total fresh water abstraction in a country as a percentage of its long-term annual average available water (LTAA) from renewable fresh water resources (groundwater and surface water). Total fresh water abstraction includes water removed from any fresh water source, either permanently or temporarily (for example water abstraction for agriculture or for cooling purposes). Mine water and drainage water as well as water abstractions from precipitation are included, whereas water used for hydroelectricity generation (in situ use) is excluded. The indicator also illustrates pressure on groundwater resources. Water scarcity is noticeable above a threshold of 20 %, whereas severe scarcity regions show WEI values beyond 40 %. The indicator is based on data from the Water Statistics of the European Statistical System (ESS).
).png)
Source: Eurostat (sdg_06_60)
Direct access to
More detailed information on EU SDG indicators for monitoring of progress towards the UN Sustainable Development Goals (SDGs), such as indicator relevance, definitions, methodological notes, background and potential linkages, can be found in the introduction of the publication ’Sustainable development in the European Union — Monitoring report - 2019 edition’.