Archive:Household accounts at regional level
- Data from March 2010, most recent data: Further Eurostat information, Main tables and Database.
One of the primary aims of regional statistics is to measure the wealth of regions. This is of particular relevance as a basis for policy measures which aim to provide support for less well-off regions.
The indicator most frequently used to measure the wealth of a region is regional gross domestic product (GDP), usually expressed in purchasing power standard (PPS) per inhabitant to make the data comparable between regions of differing size and purchasing power.

GDP is the total value of goods and services produced in a region by the people employed in that region, minus the necessary inputs. However, owing to a multitude of interregional flows and state interventions, the GDP generated in a given region often does not tally with the income actually available to the inhabitants of the region. This article takes a look at household incomes in the regions of the European Union (EU) and how much of this is available after income distribution mechanisms have had an effect.
Main statistical findings


Private household income
In market economies with state redistribution mechanisms, a distinction is made between two stages of income distribution.
The primary distribution of income shows the income of private households generated directly from market transactions, i.e. the purchase and sale of factors of production and goods.
These include in particular the compensation of employees - i.e. income from the sale of labour as a factor of production. Private households can also receive income on assets, particularly interest, dividends from equity shares and rents. Then there is also income from operating surpluses and self-employment. Interest and rents payable are recorded as negative items for households in the initial distribution stage. The balance of all these transactions is known as the primary income of private households.
Primary income is the point of departure for the secondary distribution of income, which means the state redistribution mechanism. All social benefits and transfers other than in kind (monetary transfers) are now added to primary income. From their income, households have to pay taxes on income and wealth, pay their social contributions and effect transfers. The balance remaining after these transactions have been carried out is called the disposable income of private households.
For an analysis of household income, a decision must first be made about the unit in which data are to be expressed if comparisons between regions are to be meaningful.
For the purposes of making comparisons between regions, regional GDP is generally expressed in PPS so that meaningful volume comparisons can be made. The same process should therefore be applied to the income parameters of private households. These are therefore converted with specific purchasing power standards for final consumption expenditure called purchasing power consumption standards (PPCS).
Results for 2007
Primary income
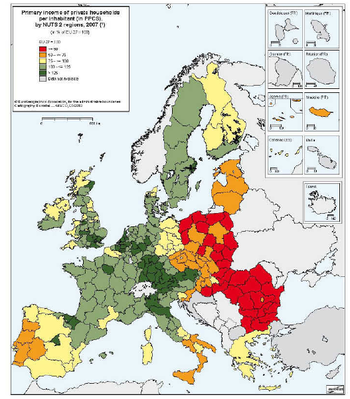
Map 1 gives an overview of primary income in the NUTS - 2 regions of the 24 countries examined here. Centres of wealth are clearly evident in southern England, Paris, northern Italy, Austria, Madrid and north-east Spain, Vlaams Gewest, the western Netherlands, Stockholm, Nordrhein- Westfalen, Hessen, Baden-Wurttemberg and Bayern. Also, there is a clear north–south divide in Italy and a west–east divide in Germany, whereas in France income distribution is relatively uniform between regions. The United Kingdom, too, has a north–south divide, although less marked than the divides in Italy and Germany.
In the new Member States, most of the regions with relatively high primary incomes are capital regions, in particular Bratislava (105 % of the EU- 27 average) and Praha (98 %). Zahodna Slovenija and Kozep-Magyarorszag (Budapest) also have primary incomes higher than 75 % of the EU average. All the regions of the Czech Republic, apart from Praha, and 13 other regions in the new Member States have primary incomes of private households higher than half of the EU average. The figure is below 50 % in the other regions of the new Member States.
The regional values range from 3 406 PPCS per inhabitant in Severozapaden (Bulgaria) to 34 842 PPCS in the UK region of Inner London. The 10 regions with the highest income per inhabitant include five regions in the UK, three in Germany and one each in France and Belgium. This clear concentration of regions with the highest incomes in the United Kingdom and Germany is also evident when the ranking is extended to the top 30 regions: this group contains 11 German and six UK regions, along with three regions each in Italy and Austria, two each in Belgium and the Netherlands, and one each in France, Spain and Sweden.
It is no surprise that the 30 regions at the tail end of the ranking are all located in the new Member States; they are 12 of the 16 Polish regions, all six Bulgarian regions, seven of the eight Romanian regions, four Hungarian regions and one Slovakian region. In 2007, the highest and lowest primary incomes in the EU regions differed by a factor of 10.2. Seven years earlier, in 2000, this factor had been 14.7. There was therefore a considerable narrowing of the gap between the opposite ends of the distribution over the period 2000–07. This positive development can be attributed partly to the Romanian and Bulgarian economies catching up compared to the rest of the EU.
Disposable income
A comparison of primary income with disposable income (Map 2) shows the levelling influence of state intervention. This particularly increases the relative income level in some regions of Italy and Spain, in the west of the United Kingdom and in parts of eastern Germany. Similar effects can be observed in the new Member States, particularly in Hungary, Romania, Bulgaria and Poland. However, the levelling out of private income levels in the new Member States is generally less pronounced than in the EU-15 Member States.
Despite state redistribution and other transfers, most capital regions maintain their prominent position with the highest disposable incomes of the country in question. The regional values range from 3 575 PPCS per inhabitant in Severozapaden (Bulgaria) to 24 733 PPCS in the UK region of Inner London. Of the 10 regions with the highest per inhabitant disposable income, four each are in the UK and in Germany, and one each in France and Italy.
The region with the highest disposable income in the new Member States is Bratislavsky kraj with 13 749 PPCS per inhabitant (93 % of the EU-27 average), followed by the Praha region with 13 180 PPCS (90 %).
A clear regional concentration is also evident when the ranking is extended to the top 30 regions: this group contains 12 German and six UK regions, along with five regions in Austria, three in Italy, two in Spain and one each in Belgium and France.
The tail end of the distribution is very similar to the ranking for primary income. The bottom 30 include nine Polish and seven Romanian regions, six Bulgarian regions, five Hungarian regions, one Slovakian region and Estonia and Latvia. State activity and other transfers significantly reduce the difference between the highest and lowest regional values in the 24 countries dealt with here from a factor of around 10.2 to 6.9.
For disposable income there has been a significant trend towards a narrower spread in regional values over recent years: between 2000 and 2007 the difference between the highest and lowest values fell from a factor of 11.1 to 6.9. Like primary income, this positive development is partly the result of the economic catch-up process in Romania and Bulgaria.
To summarise, between 2000 and 2007, there was a clear narrowing of the difference between the highest and lowest regional values for both primary income and disposable income (influenced by state interventions and other transfers).
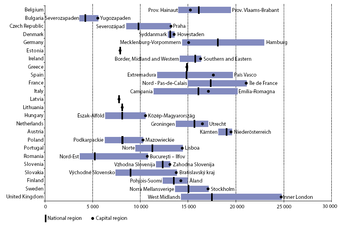
The regional spread in disposable income within the individual countries is naturally much lower than for the EU as a whole, but varies considerably from one country to another. Graph 5.1 gives an overview of the spread of disposable income per inhabitant between the regions with the highest and the lowest values for each country. It can be seen that, with a factor of almost 3, the regional disparity is greatest in Romania. This means that available income per inhabitant in Bucureşti - Ilfov is almost three times higher than in the Nord-Est region. Slovakia, the UK and Italy also have high regional differences with factors of between 1.7 and 1.9. In Hungary, Spain, Poland and Germany the highest values are, in each case, between 60 and 67 % above the lowest.
The regional differences tend to be higher in the new Member States than in the EU-15. Of the new Member States, Slovenia with 12 % has the smallest spread between the highest and lowest values and thus comes close to Denmark (5 %) and Austria (8 %), which have the lowest regional income disparities. Ireland, Finland, the Netherlands and Sweden also have only moderate regional disparities, with the highest values between 15 % and 25 % above the lowest values. Figure 1 also shows that the capital city regions of 13 of the 20 countries with more than one NUTS 2 region where data are available also have the highest income values. All seven new Member States with at least two NUTS - 2 regions belong to this group.
The economic dominance of the capital regions is also evident when their income values are compared with the national averages. In four countries (the Czech Republic, Romania, Slovakia and the United Kingdom), the capital city regions exceed the national values by more than a third. Only in Belgium and Germany are the values for the capital lower than the national average.
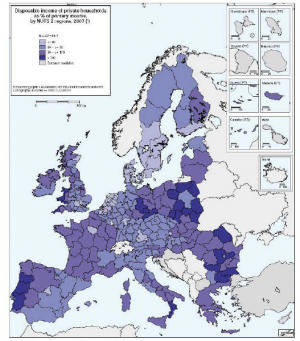
To assess the economic situation in individual regions, it is important to know not just the levels of primary and disposable income but also their relationship to each other. Map 3 shows this quotient, which gives an idea of the effect of state activity and of other transfer payments. On average, disposable income in the EU-27 amounts to 86.4 % of primary income. The figure was 86.4 % in 2000 too, so over this seven-year period the scale of state intervention and other transfers has not changed.
The lowest values are to be found in the capital regions of the more affluent Member States, in particular Hovedstaden (Denmark) at 65.7 % and Stockholm (Sweden) at 68.3 %; the highest values are found in rural regions away from economic centres, such as Lubelskie (Poland) at 105.9 % and Alentejo (Portugal) at 105.8 %.
In general, the EU-15 Member States have somewhat lower values than the new Member States. On closer inspection, typical differences can be seen between the regions of the Member States. Disposable income in the capital cities and other prosperous regions of the EU-15 is generally less than 80 % of primary income. Correspondingly higher percentages can be observed in all the Member States in the less affluent areas, in particular on the southern and south-western peripheries of the EU, in the west of the United Kingdom and in eastern Germany. The reason for this is that, in regions with relatively high income levels, a larger share of primary income is transferred to the state in the form of taxes. At the same time, state social benefits amount to less than in regions with relatively low income levels.
The regional redistribution of wealth is generally less significant in the new Member States than in the EU-15. For the capital regions the values are mostly between 75 % and 85 % and are almost without exception at the bottom end of the ranking within each country. This shows that incomes in these regions require much less support through social benefits than elsewhere. The difference between the capital region and the rest of the country is particularly large in Slovakia, at around 15 percentage points.
In the 24 EU Member States examined here, disposable income exceeds primary income in a total of 24 regions. These are nine Polish regions, four German, three regions each in Bulgaria and Portugal, two each in Romania and the UK and one in Italy. Map 3 clearly shows that these are particularly poor regions of the Member States in question. The highest value is to be found in Lubelskie (Poland), where disposable income exceeds primary income by 5.9 %. No clear differences in support for the incomes of private households between the new Member States and the EU-15 countries were found. When interpreting these results, however, it should be borne in mind that it is not just monetary social benefits from the state which may cause disposable income to exceed primary income. Other transfer payments (e.g. transfers from people temporarily working in other regions) can play a role in some cases.
Dynamic development on the edges of the Union
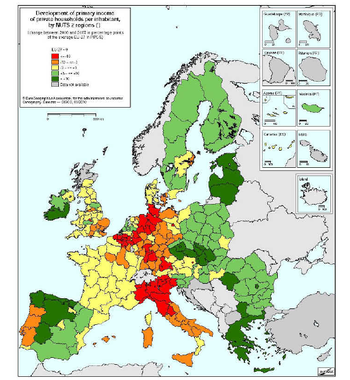
The focus finally turns to an overview of mediumterm trends in the regions compared with the EU- 27 average. Map 4 uses a seven-year comparison to show how disposable income per inhabitant (in PPCS) in the NUTS - 2 regions changed between 2000 and 2007 compared to the average for the EU-27.
It shows, first of all, dynamic processes at work at the edges of the Union, particularly in Spain and Ireland, the Czech Republic, Slovakia, Romania, the Baltic States and Finland.
On the other hand, incomes have grown at a below-average rate in most of the EU’s founding Member States. Belgium, Germany and Italy have been particularly hard hit; there, incomes fell back considerably, compared to the average, even in some not particularly prosperous regions.
The changes range from +33.2 percentage points compared to the EU-27 average for Bucureşti - Ilfov (Romania) to –24.9 percentage points for Brussels.
Despite overall clear evidence that the new Member States are catching up, the same positive trend is not found everywhere. In some regions of Hungary and Poland, disposable incomes rose by just a few percentage points compared to the EU average. The figures for Romania and Bulgaria, on the other hand, are very encouraging. With an increase of +33.2 percentage points, the Bucureşti - Ilfov region achieved the highest relative improvement of all EU regions, with even the Bulgarian region of Severozapaden (with the lowest income in the whole of the EU) catching up by 6.3 percentage points compared to average income growth in the EU. The structural problem nevertheless remains that, in most of the new Member States, the wealth gap between the capital city and the less prosperous parts of the country has widened further.
On the whole, the trend between 2000 and 2007 resulted in a slight flattening at the top of the regional income distribution band, caused in particular by substantial relative falls in regions with high levels of income. Over the same period, the 10 regions at the bottom of the scale, all in Bulgaria or Romania, caught up by between 3.2 and 9.2 percentage points compared to the EU average.
Conclusion
The regional distribution of household income differs from that of regional GDP in a large number of NUTS - 2 regions, in particular because, unlike regional GDP, the figures for the income of private households are not affected by commuter flows. In some cases, other transfer payments and flows of other types of income received by private households from outside their region also play a role.
Taken together, state intervention and other influences bring the spread of disposable income between the most prosperous and the economically weakest regions in the reporting year 2007 down to a factor of around 6.9, whereas the two extreme values of primary income per inhabitant differ by a factor of 10.2. The flattening out of regional income distribution, which is generally considered to be desirable, is therefore being achieved.
The income level of private households in the new Member States continues to be far below that in the EU-15; in only a small number of capital regions are income values more than three quarters of the EU average.
An analysis of the seven-year period from 2000 to 2007 shows incomes catching up with the EU-27 average in most, but not all, regions of the new Member States. In Romania, a strong catching up process has taken hold, a development which, fortunately, extends beyond the capital region of Bucureşti - Ilfov.
For both primary and disposable income there is a clear trend towards a narrowing of the spread in regional values: between 2000 and 2007 the factor between the highest and lowest value for primary income fell from 14.7 to 10.2. The spread for disposable income narrowed from 11.1 to 6.9. This positive development can be attributed partly to the Romanian and Bulgarian economies catching up with the rest of the EU.
It should be noted that regular deliveries of data from Bulgaria have further improved the completeness of the income data. This means that regional income data are now available for 99.3 % of the EU population. Once a complete data set is available, data on the income of private households could be taken into account alongside GDP statistics when decisions are taken on regional policy measures.
Data sources and availability
Eurostat has had regional data on the income categories of private households for a number of years. The data are collected for the purposes of the regional accounts at NUTS level 2.
There are still no data available at NUTS 2 level for the following regions: Bulgaria, France’s overseas departments, Cyprus, Luxembourg and Malta. For Denmark and Slovenia, only national data are available. For Italy, regional figures were available only up to and including 2004, but national figures were available for 2005. The regional figures for 2005 were, therefore, estimated using the regional structure from 2004.
The text in this article, therefore, relates to only 23 Member States, or 251 NUTS 2 regions. Three of these 23 Member States consist of only one NUTS 2 region, namely Estonia, Latvia and Lithuania. Since the beginning of 2008, Denmark and Slovenia have consisted of five and two NUTS 2 regions, respectively, but they appear here only as single NUTS 1 regions, as no data are yet available for the newly defined NUTS 2 regions.
Owing to the limited availability of data, the EU values for the regional household accounts had to be estimated. For this purpose, it was assumed that the share of the missing Member States in household income for the EU as a whole was the same as for GDP. For the reference year 2005, this portion was 0.6 %.
Data that reached Eurostat after 8 April 2008 are not taken into account in this article.
Context
One drawback of regional GDP per inhabitant as an indicator of wealth is that a ‘place-of-work’ figure (the GDP produced in the region) is divided by a ‘place-of-residence’ figure (the population living in the region). This inconsistency is of relevance wherever there are net commuter flows — i.e. more or fewer people working in a region than living in it. The most obvious example is the Inner London region of the UK, which has by far the highest GDP per inhabitant in the EU. Yet this by no means translates into a correspondingly high income level for the inhabitants of the same region, as thousands of commuters travel to London every day to work but live in the neighbouring regions. Hamburg, Vienna, Luxembourg, Prague and Bratislava are other examples of this phenomenon.
Apart from commuter flows, other factors can also cause the regional distribution of actual income not to correspond to the distribution of GDP. These include, for example, income from rent, interest or dividends received by the residents of a certain region, but paid by residents of other regions.
This being the case, a more accurate picture of a region’s economic situation can be obtained only by adding the figures for net income accruing to private households.
Further Eurostat information
Publications
- Eurostat regional yearbook 2010 (available in English, French and German)
Main tables
- Regional economic accounts - ESA95 (t_reg_eco)
- Disposable income of private households, by NUTS 2 regions (tgs00026)
- Primary income of private households, by NUTS 2 regions (tgs00036)
Database
- Regional economic accounts - ESA95 (reg_eco)
- Household accounts - ESA95 (reg_ecohh)
- Allocation of primary income account of households at NUTS level 2 (reg_ehh2p)
- Secondary distribution of income account of households at NUTS level 2 (reg_ehh2s)
- Income of households at NUTS level 2 (reg_ehh2inc)
- Household accounts - ESA95 (reg_ecohh)