Archive:E-government statistics
- Data from May 2010, most recent data: Further Eurostat information, Main tables and Database.
Online interactions of European businesses and citizens with public administrations
This article highlights the development and use of information and communication technology (ICT) for interacting with public administrations in the European Union (EU). This is one aspect of e-government, which is designed to improve public services and democratic processes by means of the Internet. Inclusion and better public services are part of the third priority of the European Commission i2010 initiative.
Main statistical findings
- The types of electronic interaction with public administrations are, in order of popularity:
- obtaining information
- downloading forms
- returning completed forms electronically
- managing administrative procedures completely electronically
- In the EU, there is a steady increase in the proportion of both individuals and businesses that interact with public authorities via the Internet.
- From 2004 to 2009, the proportion of enterprises (businesses and companies) which were interacting with public bodies over the Internet was higher, and growing at a faster rate, than the proportion of individuals.
- Lithuania has the highest proportion of companies that return completed forms over the Internet and, between 2004 and 2009, Lithuania progressed the most in returning such forms.
- A higher percentage of large enterprises (as compared to medium-sized and small ones) interact online with public authorities.
- After a steady increase from 2004 to 2007, the share of citizens interacting with public authorities has stagnated since 2007 in the EU overall.
- More than one third of Internet users in 2006 have already profited from e-government services and another 37 % would be interested in doing so.
- Educational levels influence the actual use of e-government services as well as the interest in using them.
- Lack of personal contact is the most frequent reason for not using e-government services.
- There is a relationship between the types of e-government services requested and a citizen's profile based on age, professional and social status.
Development of e-government services usage

The most frequent type of interaction with public administrations over the Internet is to obtain information, followed by downloading official forms. The least frequent (of the three interaction types) is the returning of completed forms. In 2006, figures for the downloading of official forms by enterprises reached the same level as those for obtaining information. In 2009, 65 % of European enterprises downloaded official forms, as compared to 17 % of individuals. The discrepancy is even higher for returning completed forms. A higher percentage of enterprises interact with public administrations than do individuals. This can be partly explained by the disparities in their Internet access and connections. In 2009, 93 % of businesses, as compared to 65 % of households, had Internet connections. Furthermore, businesses are likely to have more interactions with public authorities than individuals anyway. And these business interactions offer a high potential for automating processes - which can increase business efficiency. However, the actual level of such interactions is also determined by the online availability of the public administration. Finally, the reference period for enterprises was one year while it was three months for individuals.
In 2005, the biggest increase for both enterprises and individuals was in the downloading of forms, whereas in 2006, the interaction "returning completed forms" showed the highest growth rates. This latter type of interaction is very interesting for cost savings, as it has the potential to become fully automated. From the public administration side, receiving completed forms online represents a first step towards a fully electronic case-handling process. In 2007, all three types of interactions increased considerably for individuals, whereas the growth rate for enterprises was lagging behind. From 2008 onwards, we observe a stagnation for electronic interactions between citizens and public administrations, whereas the share of enterprises increases again.
E-government services and enterprises
In 2009, almost two thirds (65 %) of EU enterprises either obtained information or downloaded official forms from public authorities' websites. More than half (55 %) of these enterprises then returned the completed forms to public administrations. 44 % of the enterprises treated administrative procedures completely electronically, i.e. without the need for exchanging information in paper form. Around one tenth (11 %) of the enterprises submitted a proposal using an electronic tendering system.
| Obtaining information | Downloading forms | Sending filled forms | Treating administrative procedure completely electronically | Submitting a proposal in an electronic tender system | |
|---|---|---|---|---|---|
| All enterprises | 65 | 64 | 55 | 44 | 11 |
| Large enterprises | 85 | 84 | 79 | 63 | 21 |
| Medium-sized enterprises | 78 | 79 | 72 | 57 | 16 |
| Small enterprises | 62 | 61 | 51 | 41 | 10 |
| Enterprises with broadband connection | 70 | 70 | 60 | 48 | 12 |
| Enterprises with narrowband connection | 55 | 55 | 44 | 31 | 9 |
The volume of interaction between businesses and public administrations varies with the Internet connection bandwidth and the size of the enterprise. A higher percentage of enterprises with broadband, compared to narrowband connections, interact with public authorities. However, the largest divergence between enterprises is due to their size. 89 % of large enterprises and 84 % of medium-sized enterprises interact with public administrations online as compared to only 69 % of small enterprises. The increase between 2005 and 2009 was 13 percentage points for large and medium sized enterprises and 15 percentage points for small enterprises. However, considering the already reached levels in 2005, large enterprise filled more than half of the remaining gap (from 76 % to full saturation at 100 %) until 2009 while this increase was only one third for small enterprises (15 % points out of 46 % points from 2005 to 2009). Obviously, large enterprises take more advantage of the Internet for interacting with public administrations.
| EU-27 | BE | BG | CZ | DK | DE | EE | IE | EL | ES | FR | IT | CY | LV | LT | LU | HU | MT | NL | AT | PL | PT | RO | SI | SK | FI | SE | UK | IS | NO | |
|---|---|---|---|---|---|---|---|---|---|---|---|---|---|---|---|---|---|---|---|---|---|---|---|---|---|---|---|---|---|---|
| 2004 | 28 | 26 | 9 | 24 | : | 17 | 54 | 32 | 45 | 32 | : | 35 | 11 | 15 | 30 | 26 | 23 | : | 27 | 47 | 68 | 50 | 12 | 36 | 18 | 61 | 53 | 12 | : | 40 |
| 2005 | 33 | 33 | 11 | 32 | 56 | 24 | 50 | 42 | 56 | 35 | : | 29 | 9 | 15 | 52 | : | : | 45 | 44 | 41 | 60 | 52 | : | 45 | 16 | 71 | 48 | 19 | : | 59 |
| 2006 | 44 | 37 | 23 | 32 | 55 | 37 | 54 | 56 | 76 | 38 | 51 | 49 | 8 | 21 | 56 | 32 | 28 | 35 | 61 | 54 | 56 | 54 | 13 | 49 | 45 | 78 | 53 | 38 | 81 | 62 |
| 2007 | 45 | 37 | 29 | 34 | 61 | 43 | 58 | 69 | 77 | 38 | 59 | 35 | 14 | 26 | 60 | 35 | 44 | 49 | 73 | 54 | 56 | 66 | 20 | 61 | 56 | 78 | 55 | 40 | : | 61 |
| 2008 | 50 | 49 | 43 | 35 | 65 | 45 | 62 | 69 | 66 | 45 | 67 | 42 | 18 | 39 | 75 | 41 | 50 | 46 | 75 | 59 | 60 | 68 | 23 | 69 | 51 | 81 | 58 | 51 | 87 | 63 |
| 2009 | 55 | 65 | 47 | 36 | 66 | 52 | 64 | 66 | 61 | 46 | 67 | 48 | 15 | 51 | 85 | 42 | 58 | 51 | 74 | 58 | 57 | 70 | 25 | 75 | 59 | 83 | 61 | 57 | : | 71 |
Between 2004 and 2009, at the European level (EU-27), the proportion of companies that returned completed forms via the Internet increased from 28 % to 50 %. From 2005 to 2006, this development had accelerated but, in 2007, progress almost came to a standstill. This was due to the results from Belgium, Spain, Italy, Austria, Poland and Finland, whereas in other Member States there had been a considerable increase, namely in Ireland, Hungary, Portugal, Slovenia and Slovakia. In 2008, at EU level, the proportion of enterprises returning forms online increased by 5 %. The countries with the largest percentage of interacting companies were Finland, followed by Lithuania and the Netherlands. Considering the initial level in 2004, the highest increase can be found in the Netherlands, Lithuania, Ireland and Slovenia. Between 2004 and 2008, at the EU level, the probability that enterprises would return completed forms online to public administrations almost doubled.
E-government services and the citizens
Use of online services by the citizens
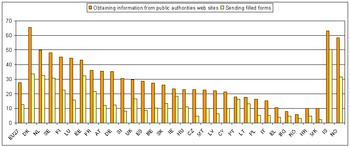
On average, 28 % of the European citizens accessed information on public authorities' websites in 2009. Only 13 % of European citizens sent information electronically within 3 months prior to the survey in 2009. There is still a big potential for e-government services to citizens in Europe, which can be exploited in the next years. There are big differences in the percentage of use of online services between the European countries. While almost two thirds (65 %) of the citizens in Denmark have already looked for information from public authorities online, only 6 % of Romanian citizens have searched for information on public authorities' websites. Providing information online is the first step of sophistication of e-government initiatives. The next steps are to give the possibility to download forms from the Internet and to complete online forms and send them to public administrations online. The last step requires to introduce new business processes in public administrations requiring considerable investments from the governments. On the other hand, this bears a high potential of rationalisation for public administrations and leads to more transparent and faster procedures. Comparing the European countries, Denmark, the Netherlands, Estonia and Sweden are the leading countries where the highest percentage of citizens send electronic forms to public administrations. In the Czech Republic, Bulgaria, Greece and Romania, this percentage is below 5 % in 2009.
Use of online services by socio-economic groups
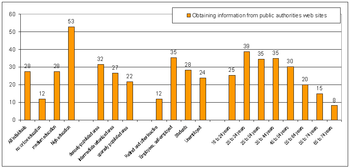
The digital divide is visible in the use of e-government services, too. The share of persons interacting electronically with public authorities is remarkably different comparing different groups of the society. On average, 28 % of the citizens within the EU have obtained information online from public authorities' websites in 2009. More than half (53 %) of persons with higher formal education used these services compared to only 12 % of persons with no or low formal education. Differences by educational attainment are the most remarkable within the data set. A higher percentage of persons living in urban areas (32 %) have accessed information on public authorities' website than those living in rural areas (22 %). The most significant figure related to occupation is the low percentage of retired and inactive persons having obtained information online from public authorities in 2009. This phenomenon can as well be observed for the different age classes. Starting with the age class 25 to 34 years, the percentage of persons accessing information online decreases from 39 % to a minimum of 8 % for the age class 65 to 74 years. Normally, the youngest age group shows the highest percentage of Internet activities among the different age groups. This is not the case for e-government activities, which can be explained by less need or fewer obligations concerning administrative procedures for younger people.
Interest in using e-government services
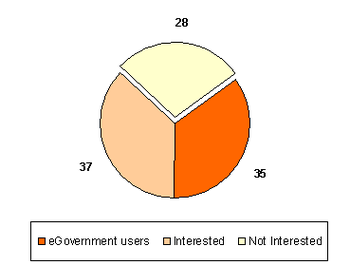
In 2006, within the EU, more than a third (35 %) of individual Internet users had already used e-government services. In addition, another 37 % of them would have been interested in replacing personal visits to public authorities with services via the Internet. However, the remaining 28 % of Internet users were not interested in requesting services from public authorities online. The highest percentage of Internet users who already use e-government services are found in Iceland, Denmark, the Netherlands and Estonia. The highest proportion of Internet users who are not interested in e-government services are found in Latvia, the Czech Republic, Romania and Ireland. As expected, there is a tendency for those Member States with a high percentage of e-government users to show a corresponding lower percentage of potential users.
| EU-27 | BE | BG | CZ | DK | DE | EE | IE | EL | ES | FR | IT | CY | LV | LT | LU | HU | MT | NL | AT | PL | PT | RO | SI | SK | FI | SE | UK | IS | NO | |
|---|---|---|---|---|---|---|---|---|---|---|---|---|---|---|---|---|---|---|---|---|---|---|---|---|---|---|---|---|---|---|
| E-government users | 35 | 22 | 29 | 14 | 57 | 49 | 50 | 37 | 19 | : | 40 | 21 | 11 | 12 | 32 | 25 | 18 | : | 53 | 35 | 14 | 41 | 9 | 45 | 18 | 25 | 32 | 29 | 79 | 43 |
| Interested | 37 | 34 | 40 | 32 | 16 | 36 | 17 | 15 | 35 | : | : | 41 | 62 | 26 | 24 | 43 | 45 | : | 16 | 21 | 42 | 22 | 40 | 23 | 44 | 44 | 19 | 53 | 8 | 17 |
| Not interested | 28 | 44 | 31 | 55 | 25 | 15 | 32 | 47 | 46 | : | : | 34 | 27 | 61 | 44 | 32 | 37 | : | 29 | 44 | 44 | 38 | 51 | 32 | 39 | 24 | 48 | 18 | 13 | 40 |
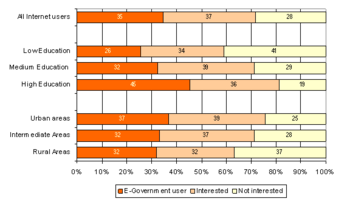
Education is a factor that influences the ability and willingness of individuals to replace personal visits to public authorities by e-government services. Those with a higher level of education are more likely to use e-government services, whereas the proportion of individuals who are not interested in e-government services is the highest among those with low educational backgrounds. And remarkable differences can be seen between urban, intermediate and rural areas, primarily in the percentage of Internet users who are not interested in e-government. Internet users in rural areas are less interested than those users in urban areas, although the former may benefit more from using e-government services due to the longer distances they need to travel to the authorities in rural areas, as compared to urban ones.
Reasons for abstaining from e-government services
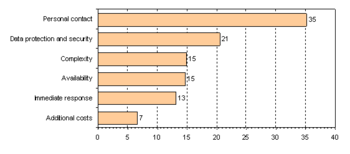
Citizens were asked for their reasons for not using online government services. The most mentioned obstacle was the lack of personal contact followed by concerns about data protection and security. The complexity of online applications and their availability were mentioned by 15 % of respondents. Moreover, 13 % missed getting an immediate response. This might be closely related to the lack of face-to-face personal contacts. Only 7 % of the citizens were concerned about additional costs incurred by online government services.
Use of e-government services by type of service

Interest among Internet users in having access to specific services online is dependent on the personal situation of the individual. Unemployed people want to use different services than, say, students. Nevertheless, there are some general services which are of interest to everyone between the ages of 16 and 74. The levels of usage of these general services, such as requesting personal documents, health-related services, house-moving announcements, requesting certificates and car registrations are very similar. Roughly two thirds of Internet users are interested in using or are already using them. However, the percentage of actual usage of those online services has to be considered in relation to their rather rare frequency.
Use of e-government services by employment situation

In the EU, the declaration of income taxes, job searches and online visits to public libraries are the services with the highest percentage of users. However, in general, people's interest in declaring their income taxes and searching for jobs is lower than their interest in the other services.
Data sources and availability
The source for the data in this article are the Community survey on ICT usage in households and by individuals and the Community survey on ICT usage in enterprises.
An EU aggregate is only calculated if the available countries represent at least 55 % of the number of Member States and at least 60 % of the EU population. “:” refers to data which are confidential, unreliable or unavailable.
Context
In the EU, the development and use of ICTs for doing business with public administrations is one aspect of e-government which is designed to improve public services and democratic processes by means of the Internet. Inclusion and better public services are part of the third priority of the EC's i2010 initiative.
Further Eurostat information
Publications
- Gender differences in the use of computers and the Internet (Statistics in focus 119/2007 - available in English, French and German)
Main tables
- i2010 Benchmarking indicators (t_isoc_pi_benchmark)
- Individuals using the Internet for interaction with public authorities (tin00105)
- Individuals using the Internet for returning filled in forms to public authorities (tin00106)
- Enterprises using the Internet for interaction with public authorities (tin00107)
- Enterprises using the Internet for returning filled in forms to public authorities (tin00108)
- Enterprises using the Internet for submitting a proposal in a public electronic tender system to public authorities (tin00109)
Database
- Policy indicators (isoc_pi)
- i2010 benchmarking indicators (isoc_pibi)
- Benchmarking indicator: Public services - eGovernment (isoc_pibips)
- e2005 Policy indicators (isoc_pi05)
- Policy indicator: e-government (isoc_pi_d)
- i2010 benchmarking indicators (isoc_pibi)
Dedicated section
Other information
- Regulation 808/2004 concerning Community statistics on the information society
- Commission Regulation (EC) 1031/2006 implementing Regulation (EC) No 808/2004 of the European Parliament and of the Council concerning Community statistics on the information society
- Regulation 847/2007 implementing Regulation (EC) No 808/2004 of the European Parliament and of the Council concerning Community statistics on the information society
- Regulation 960/2008 implementing Regulation (EC) No 808/2004 of the European Parliament and of the Council concerning Community statistics on the information society
- Regulation 1023/2009 implementing Regulation (EC) No 808/2004 of the European Parliament and of the Council concerning Community statistics on the information society
External links
See also
Notes
- ↑ Enterprises excluding: DK, FR, MT (2004); FR, HU, RO (2005). Individuals excluding: BE, FR, IT, MT, NL (2004); BG, DK, DE, FR, RO, SI (2005); PL, SE, UK (2006); see list of country abbreviations.
- ↑ % of individuals who are interested in using or do not use the Internet for dealing with public services or administrations.
- ↑ % of individuals who use or are interested in using the Internet for dealing with public services or administrations; excluding: MT (all replies); ES (would like to do); ES, FR (would not like to do) except job search; BG (already done) except health, tax, job search, libraries; CZ , FR (already done) except job search; AT, PT, FI (car registration); FI (certificate); FR (health, tax, libraries); see list of country abbreviations
- ↑ % of individuals who use or are interested in using the Internet for dealing with public services or administrations excluding: MT (all replies); ES, FR (would like to do), ES (would not like to do); CZ (already done); FR, PT (enrolment on higher education or university); see list of country abbreviations.

