Archive:Chemicals - monitoring REACH with indicators
- Data from July 2010, most recent data: Further Eurostat information, Main tables and Database.
Since June 2007, REACH, the European Union 'Regulation on the Registration, Evaluation, Authorisation and restriction of Chemicals', is in force. The major objective of REACH is to ensure a high level of protection for human health and the environment, by increasing knowledge about the hazardous properties of chemicals.
Eurostat has developed a baseline study, providing a set of indicators that will monitor the effectiveness of REACH.
This article explains the main statistics used and the indicators developed, illustrated by tables and graphs.
Main statistical findings
Background
Previous work carried out by Eurostat in the field dates back to the period from the mid-1990s to 2000 when some Environmental Pressure Indicators (EPI) related to chemicals were developed. One of the recent priorities of Eurostat has been the development of indicators on toxic and environmentally harmful chemicals in order to be able to measure progress towards the headline objective for ‘public health’ established in the EU - Sustainable Development Strategy and the 6th EU Environment Action Programme.
The European Commission and scientific experts expressed the need for developing a baseline before REACH came into force, and an instrument to monitor the effectiveness of REACH. To do so Eurostat proposed the development of a set of risk-based (and not damage-based) indicators.
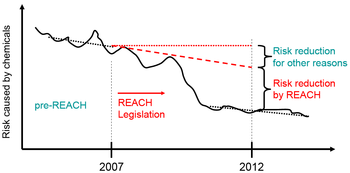
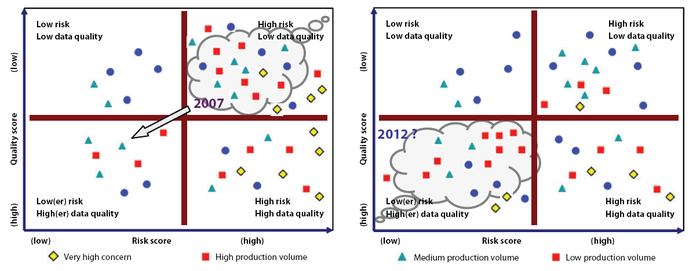
A REACH Baseline Study with the aim of setting the baseline 2007 of the potential risk for consumers, workers, and the environment was carried out. With the developed methodology, the calculations of the potential risks will be repeated for the 5-year assessment of REACH due in June 2012.
The baseline study has set up an indicator set which will allow the effects of REACH to be monitored (ensuring a high level of protection of human health and the environment as well as enhancing innovation of safer chemicals). It presents a baseline of the (potential) risk caused by chemicals and of the quality of the underlying data which were available when REACH came into force in June 2007.
Policy monitoring by indicators
Will there be a decrease in risk? Will our very limited knowledge of the properties of substances and their safe uses increase due to REACH? This baseline study aims to provide a set of indicators to monitor whether such changes take place — indicating the success of REACH. The focus of the baseline study is not restricted to indications for the risk itself: The proposed indicator system also enables changes in the quality of the public data on substances and their safe use to be detected. A first 'snapshot' of the situation before REACH has been taken now, a second will be taken after 5 years of experience acquired with the operation of REACH, additional snapshots will be made later.
Comparing the results should enable the success of the REACH legislation to be monitored and assessed.
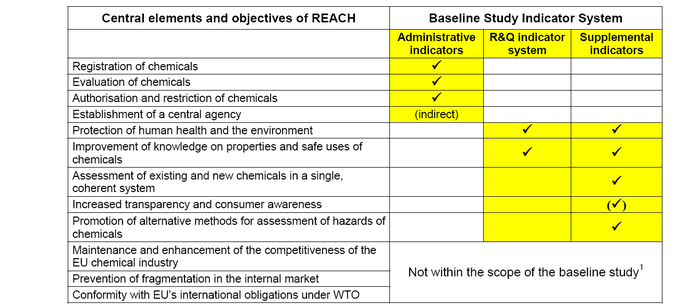
Three indicator sets combined — close to the objectives of REACH
Administrative indicators: These are used to monitor the REACH process. They refer to the registration, evaluation, authorisation and restriction steps defined by REACH. They will provide figures, for example, on the number of substances registered, the number of
chemical safety reports documented by the European Chemicals Agency or the number of dossiers being evaluated.
Risk and quality indicators: This set directly tracks two major goals of REACH: reduction in the nominal risks of chemicals for humans and the environment as well as improvement in the quality of publicly available data. These changes are assessed for a defined set of
reference substances.
Supplementary indicators: These indicators address specific objectives of REACH not covered by the other two indicator types (e.g. increase in quality of safety data sheets, use of alternative methods for assessment of chemicals instead of animal testing). They can support specific findings from the risk and quality indicator system.
Outlook to 2012
Data sources and availability
<description of data sources, survey and data availability (completeness, recency) and limitations>
Context
<context of data collection and statistical results: policy background, uses of data, …>
Further Eurostat information
Publications
Tables
- Title(s) of second level folder (if any)
- Title(s) of third level folder (if any)
Database
- Title(s) of second level folder (if any)
- Title(s) of third level folder (if any)
Dedicated section
Source data for tables and graphs on this page (MS Excel)
Other information
<Regulations and other legal texts, communications from the Commission, administrative notes, Policy documents, …>
- Regulation 1737/2005 of DD Month YYYY on ...
- Council Directive 86/2003 of DD Month YYYY
- Commission Decision 86/2003 of DD Month YYYY
<For other documents such as Commission Proposals or Reports, see EUR-Lex search by natural number>
<For linking to database table, otherwise remove: {{{title}}} ({{{code}}})>
External links
See also
Notes
[[Category:<Category name(s)>]] [[Category:<Statistical article>]]


