Archive:Economic globalisation indicators in industry, wholesale and retail trade
- Data extracted in September 2016. Most recent data: Further Eurostat information, Main tables and Database. Planned article update: September 2017.
The present article shows graphs and figures for nine indicators in industry, wholesale and retail trade to illustrate the type of information that could be used to track the various aspects of globalisation. The article International trade, investment and employment as indicators of economic globalisation showed the growing importance of globalisation for the European economy. In this article, the importance of globalisation in two specific economic sectors is discussed: industry and wholesale and retail trade.

Source: Eurostat (nama_10_a64) and data from trade by enterprise characteristics (TEC)

Source: Eurostat (nama_10_a64) and (bop_fdi6_pos)

Source: Eurostat (fats_g1a_08)
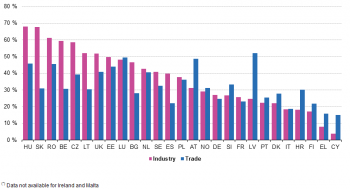
Source: Eurostat (fats_g1a_08)

Source: Eurostat (fats_g1a_08)
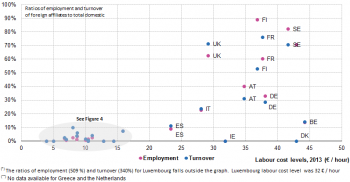
Source: Eurostat (lc_lci_lev), (fats_out2_r2) and (fats_g1a_08)

Source: Eurostat (lc_lci_lev), (fats_out2_r2) and (fats_g1a_08)
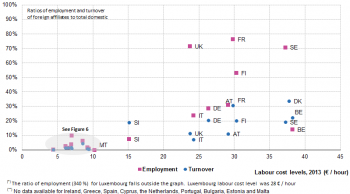
Source: Eurostat (lc_lci_lev), (fats_out2_r2) and (fats_g1a_08)

Source: Eurostat (lc_lci_lev), (fats_out2_r2) and (fats_g1a_08)
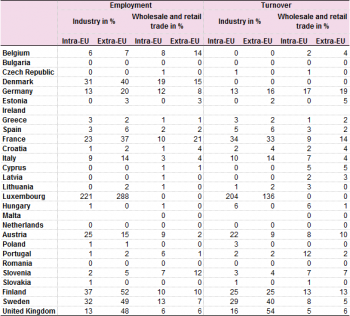
Source: Eurostat (fats_out2_r2) and (fats_g1a_08)
Source: Eurostat (fats_g1a_rd)
Main statistical findings
- Economic globalisation plays a large role in the EU’s industry and wholesale and retail trade sectors. The indicators in these two sectors have high values.
- Economic globalisation is more significant between intra-EU partners than between EU Member States and extra-EU partners, showing the importance of the single market.
- Import and export shares of gross value added (GVA) are greater for smaller economies than for larger ones; the latter have bigger domestic markets and more resources and therefore less need for international trade.
- For most Member States, the ratio of exports to imports shows that there is a positive trade balance in industry and a negative trade balance in wholesale and retail trade.
- The share of total domestic turnover for foreign controlled enterprises is almost always higher than their share of total employment, implying higher turnover per person employed than in domestically controlled enterprises.
- For foreign affiliates, the ratios of employment and turnover to domestic employment and turnover are generally higher in Member States with high labour costs.
- The highest shares of foreign-controlled R&D expenditure in total domestic R&D expenditure for intra-EU partners are found in Member States that joined the EU in 2004 or later. For extra-EU partners, these shares are higher in countries that were Member States before then.
There are of course exceptions to these findings. At the same time, there are many other aspects influencing globalisation, such as history, infrastructure, human capital, tax rules, wages and price levels and business climate, but these fall outside the scope of this article.
International trade in goods
Table 1 shows the exports and imports of goods divided by Gross Value Added (GVA), and the ratio of exports to imports by country. At first sight, it might seem strange to find ratios of more than 100 % in exports and imports divided by GVA. However, this is not unusual because GVA is calculated using net exports (exports minus imports). Thus, whenever exports and imports are high compared with domestic consumption, investment and government expenditure, these indicators can have values of more than 100 %.
When we compare intra and extra-EU figures for exports and imports, we see that almost always the intra-EU figures are higher than the extra-EU figures: this underlines the importance of the single market. For all Member States intra-EU imports and exports were more important than extra-EU imports and exports in wholesale and retail trade. The same was the case for industry for most EU Member States; for both Greece and the UK extra-EU imports and exports were higher than intra-EU imports and exports. Comparing industry with wholesale and retail trade, we see a clear difference in the export and import figures for these sectors. Industry typically has greater shares of exports while wholesale and retail trade has larger shares of import. A possible explanation is that industry Member States tend to import relatively cheap raw materials and intermediate products, while exporting more expensive final products.
The combined effect of lower imports and higher exports in industry gives most countries a positive trade balance, while in wholesale and retail trade the opposite is true. This can clearly be seen in the last four columns of Table 1 (exports divided by imports), which mostly give values higher than 1 for industry and lower than 1 for wholesale and retail trade.
Foreign direct investment
Table 2 shows foreign direct investment (FDI) to and from EU countries divided by GVA. Just as for imports and exports of goods, we find that intra-EU investments divided by GVA are generally higher than extra-EU. This is more prominent for inward than for outward investments. Comparing FDI between industry and wholesale and retail trade, we see that, in general, FDI as a percentage of GVA is higher in industry than in wholesale and retail trade. This seems to be especially the case for larger economies with the exception of Germany.
For most countries, intra-EU inward investments are larger than outward investments while for extra-EU it is slightly more often the other way around: outward investments are greater than inward.
Differences between small and large economies give a more mixed picture for FDI than they do for imports and exports. Some large economies, such as France, Germany and Italy, have low ratios of FDI stocks to GVA; others, such as Spain and the United Kingdom, have fairly high ratios. It is not clear whether these differences are because of economic phenomena or due to regulatory differences between countries.
Employment and turnover in foreign controlled enterprises
An enterprise is foreign controlled when another enterprise from abroad owns, directly or indirectly, 50% or more of the shares. Figures 1 and 2 respectively show the proportion of employment and turnover to total employment and turnover in foreign controlled enterprises. The pattern for both is obviously quite similar: countries that have high shares of employment in foreign controlled enterprises also have high shares of turnover in foreign controlled enterprises. For almost all countries, the shares are higher in industry than in wholesale and retail trade.
When comparing employment and turnover shares in Table 3, we see that in almost all cases turnover shares are higher than employment shares. In industry, only in 3 of 26 countries for both intra- and extra EU partners is the opposite true. In wholesale and retail trade, we find 2 of 26 countries for intra-EU partners and 1 of 26 countries for extra-EU partners where this is the case. Since both are shares of total domestic employment and turnover, this implies a higher turnover per person employed for foreign controlled enterprises than for domestically controlled enterprises.
Employment and turnover in foreign affiliates
In contrast to foreign control, where the controlling enterprise is abroad, domestic enterprises can also control a foreign enterprise. In that case, the controlled enterprise is said to be a foreign affiliate. In Figure 3 and 4 (for industry) and Figure 5 and 6 (for wholesale and retail trade), we have plotted the ratios of employment and turnover of foreign affiliates to total domestic employment and turnover against the labour cost levels. In industry, we find the highest ratios for Luxembourg[1], the Nordic Member States and the United Kingdom, France, Germany and Austria. These countries also have a high level of labour costs. In wholesale and retail trade, the countries that have high ratios and high levels of labour costs are mostly the same. It is likely that this indicates that the ratios are influenced not only by a country’s own labour cost levels but also by the levels in neighbouring countries. In the article International sourcing of business functions, we also found that the highest proportion of sourcing internationally is observed in small, open economies with high labour costs. That article also found that sourcing is still mainly driven by industry enterprises which are increasingly sourcing support business functions.
Table 4 breaks down the ratios for extra-EU and intra-EU partners. Again, we find that in most countries globalisation plays a bigger role in industry than in wholesale and retail trade. When comparing intra-EU and extra-EU rates, we see that in wholesale and retail trade more countries have higher intra-EU values than extra-EU. For industry, this is also the case for turnover but not for employment. In the article Foreign affiliates statistics — employment by business function, we also found that enterprises engaged in international sourcing were more likely to have intra-EU foreign affiliates than extra-EU affiliates, and that industry enterprises were more likely than services enterprises to have foreign affiliates.
Research and development in foreign controlled enterprises
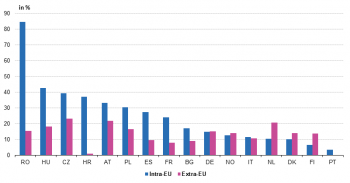
R&D statistics of foreign controlled enterprises are collected for the NACE-sections B to F of the non-financial business economy, which include industry (section C) but not wholesale and retail trade (section G). Therefore, Figure 7 only contains this indicator for industry showing that shares vary between 7 % and 78 %. Slovakia, Czech Republic and Hungary have high values, while Finland, Portugal and Estonia have the lowest shares. Among the larger European economies, Germany and France have relatively low shares of around 20 %, while the United Kingdom has a share that is relatively high (58 %), with Spain (39 %) falling in between.
In Figure 8, the indicator has been broken down by intra-EU and extra-EU partners. The three countries with the highest proportion of intra-EU expenditure in 2011 (Slovakia, the Czech Republic, Hungary) are Member States that joined the EU in 2004. In contrast, for extra-EU expenditure, three of the four countries (the United Kingdom, the Netherlands, Slovakia and Austria) with the highest share are pre-2004 Member States. All of the countries that joined the EU in 2004 or later have higher shares in intra-EU expenditure than in extra-EU expenditure. For the pre-2004 Member States, some have higher shares in extra-EU expenditure (the Netherlands, Portugal, Finland and the United Kingdom) but in others, the shares are higher in intra-EU expenditure (Austria, Germany, Spain and France).
Data sources and availability
The set of indicators of economic globalisation
One of the objectives of the ESSnet project on measuring global value chains was to develop a coherent and consistent set of indicators of economic globalisation. The results of this work has substantially increased the system’s capacity to analyse globalised business and to produce statistical evidence in this area, as is often requested by those involved in developing future policies. Data for these indicators could be collected and published within the European statistical system (ESS).
The proposed framework of indicators contains a set of indicators grouped in five concepts covering various aspects of economic globalisation:
- International trade
- Foreign direct investment
- Employment
- Value added or turnover
- Research and development
Indicators are available by country and broken down by economic activitiy and main partner (intra-EU and extra-EU). Eurostat plans to provide a further breakdown of its main extra-EU partners (USA, China, India, Japan, Russia and Brazil). A further development of experimental indicators based on micro-data linking is also foreseen.
Depending on data availability not all EU Member States are shown in all tables and graphs.
Context
One of the seven flagship initiatives of the Europe 2020 strategy is its industrial policy: ‘”an industrial policy for the globalisation era” to improve the business environment, notably for SMEs, and to support the development of a strong and sustainable industrial base able to compete globally.’ Reliable indicators of economic globalisation and its impact on the EU economy are essential for the effective implementation of this policy.
Economic globalisation is the process of internationalisation caused by or experienced by economic actors in the business economy. In practice, the main indicators of economic globalisation are defined based on the variables and breakdowns the European Statistical System (ESS) is obliged to provide, in accordance with regulations such as those applying to structural business statistics, foreign affiliate statistics, national accounts and international trade in goods.
See also
- International_trade, investment and employment as indicators of economic globalisation
- Foreign affiliates statistics - employment by business function
- Microdata linking - international sourcing
- International sourcing of business functions
Further Eurostat information
Publications
- Features of International Sourcing in Europe in 2001-2006 - Statistics in focus 73/2009
- International Sourcing in Europe - Statistics in focus 4/2009
- Plans for International Sourcing in Europe in 2007-2009 Statistics in focus 74/2009
Dedicated section
This dedicated section has more information on economic globalisation. There are links to the tables with the main globalisation indicators. The indicators broken down by economic activity and partner, that were used in this article, are in the same section of the Eurostat database and contain figures not only for industry and wholesale and retail trade but also for other sections of the non-financial business economy.
Methodology / metadata
- Foreign affiliates of EU enterprises - outward FATS (ESMS metadata file — fats_out_esms)
- Foreign controlled EU enterprises - inward FATS (ESMS metadata file — fats_esms)
- European Union direct investments (ESMS metadata file — bop_fdi_esms)
- International trade (ESMS metadata file — ext_esms)
Source data for tables, figures and maps (MS Excel)
Other information
- Commission communication COM/2010/0612 final Trade, Growth and World Affairs Trade Policy as a core component of the EU's 2020 strategy - European Commission, 2010
External links
- European Commission: Europe 2020 A strategy for smart, sustainable and inclusive growth
- European Commission - Globalisation
- OECD – Handbook on economic globalisation indicators
Notes
- ↑ The ratios of employment (509 %) and turover (340 %) for Luxembourg fall outside the graph. Luxembourg labour cost level was 32 € / hour