Archive:Marriages and births in Cyprus
- Data extracted in Month YYYY. Most recent data: Further Eurostat information, Main tables and Database. Planned article update: (dd) Month YYYY(, hh:00).
Author: Statistical Service of Cyprus - Division of Demography, Social Statistics and Tourism
This article on marriages and births is part of a pilot project implemented by Eurostat together with the Member States. The aim of the pilot project is to better reply to user's needs by complementing the Eurostat article presenting data on an EU level with more detailed information on the same topic, but at national level. Articles from the participating Member States are available in the corresponding national languages as well as in English and they form, together with the Eurostat article, an online publication.
The current article presents recent information and trends concerning marriages, divorces and fertility in Cyprus. The information is obtained from the Census of Population of 2011 as well as from annual data collections from registers concerning marriages, divorces and births.
Source:Statistical Service of Cyprus
Main statistical findings
The marital status in Cyprus, as recorded at the Census of Population of 2011
According to the Census of Population of 2011, 64,6 % of people aged 20 and over were married, while 23,9 % were single persons who were never married. A percentage of 5,8 % were widowed and a lower percentage of 4,9 % were divorced.
By comparing these results to the results of the Census of Population of 2001, it was observed that in 2011 there was a rise in the percentages of single and divorced persons, while the percentage of married people decreased.
Latest developments in marriage statistics in Cyprus
In the past few years, a large number of foreigners who married in Cyprus by civil marriage were not residing in Cyprus. In particular, out of 9 031 civil marriages celebrated in 2013, only 1 841 were civil marriages of residents of Cyprus. As from 2003, it has been possible to distinguish between civil marriages of residents and non-residents. For the purposes of this article, statistics on marriages from this point onwards will refer to the marriages of residents only.
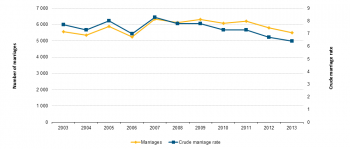
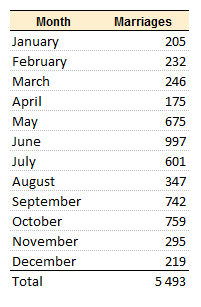
In 2013, 5 493 marriages of residents were celebrated in Cyprus, recording a crude marriage rate of 6,4 per 1 000 inhabitants. The highest number of marriages during the past decade was recorded in 2007, when 6 332 marriages took place corresponding to a crude marriage rate of 8,3.
The age at first marriage increased during the past years, from 30,5 for males and 27,8 for females in 2003, to 31,1 and 29,0 in 2013[1] respectively.
The majority of marriages (3 652 or approximately 66 %), were church marriages. Civil marriages of residents of Cyprus numbered 1 841 in 2013, constituting a proportion of 34 % of the total marriages of residents. In most of the cases of civil marriages (47,1 %), the groom and the bride were of foreign nationality and only for 20,3 % of the civil marriages, both the groom and bride were Cypriot nationals.
Marriages mainly take place during the period May – October, with the exception of August, during which there is usually a significant drop in the number of marriages.
An increasing trend in divorces
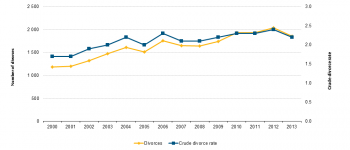
The total number of divorces in 2013 was 1 857 and the crude rate was calculated at 2,2 per thousand population. The crude divorce rate has shown a constant increase over the years, reaching 2,2 in 2013 from 1,7 in 2000 and 0,3 in 1980.
A proportion of 47,4 % of the divorced couples in 2013 reported no dependent children under 18 years old, 26,8 % reported one, 19,7% reported two and 5,2 % reported three or more. The median duration of marriage in 2013 was estimated at 9 years.
Consensual unions
The society of Cyprus has been quite conservative so consensual unions have not been very prevalent in the past. There has been however an increase in the proportion of population aged 20 and over who lived in consensual unions in 2011 as compared to 2001, according to the two Censuses of Population. In 2011, the population aged 20 and over who lived in consensual unions constituted 4,4 % of the total population aged 20 years and over, while in 2001 they constituted only 1 % of the total population aged 20 and over.
Declining birth rates and fertility
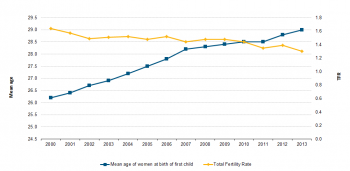
In 2013 the number of births decreased to 9 341 from 10 161 the year before, giving a crude birth rate of 10,8 per thousand population. The total fertility rate over the years has indicated a continuing declining fertility trend. In 2013, the total fertility rate decreased to 1,3 from 1,4 in 2012. It has decreased gradually from its peak of 2,5 in 1982 and since 1995 it has remained below the replacement level of 2,1.
The proportion of live births outside marriage is relatively low in Cyprus compared to other European countries. In 2013 only 1 832 children were born out of wedlock, constituting a proportion of 19,6 % of the total number of births.
The mean age of women at the birth of their first child was 29 years, increasing about 3 years since 2000, when the mean age at birth of first child was 26 years.
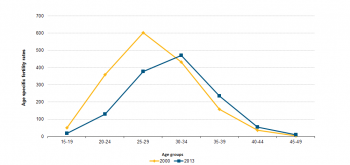
The age-specific fertility rates have shifted from lower to higher age-groups. The graph below indicates that whilst in 2000 the highest age-specific fertility rates were observed for the women aged 25-29, in 2013 the highest rates shifted to older age-groups (30-34 years), and the peak appeared to be significantly lower than that in 2000.
See also
Publications
Information on marriages, divorces, births and other demographic statistics is included in the Demographic Report published annually by the Statistical Service of Cyprus. The report can be downloaded from the website of the Statistical Service.
External links
Notes
- ↑ Estimated by the Statistical Service of Cyprus.
[[Category:<Subtheme category name(s)>|Name of the statistical article]] [[Category:<Statistical article>|Name of the statistical article]]
