Archive:Agricultural labour input
Data from May 2010, most recent data: #Target Further Eurostat information.
Results for agricultural income are measured in terms of the trend in real income per annual work unit (AWU). From year to year there have been small decreases in labour input, but these have rarely been the main driving factor behind the short term changes in Indicator A. However, over a longer period, the development in agricultural labour input constitutes one of the major changes.
Main statistical findings
EU agricultural labour down by nearly 25% since 2000
Agricultural labour in the EU has decreased by 24.9% since 2000 which, in terms of AWU, represents a drop of 3.7 million from 14.9 million AWU in 2000 to 11.2 million AWU in EU-27 in 2009. Because many farmers and farm workers are only employed part-time in agriculture, the number of people actually working in agriculture is greater than the number of annual work units.
Measured as a percentage of the total active population in the EU, agricultural labour input in AWU accounted for 4.7% in 2009 (complied based on active population 2008) compared to 6.7% in 2000. In EU-15 the respective percentages in 2009 were 2.8 as against 3.8 in 2000, although the shares – and the changes – in the 12 New Member States were much higher.
In 2009 agricultural labour input represented 12.1% in NMS-12 as a percentage of active population, while the percentage in 2000 was 17.3%, signifying that the fall in agricultural labour input on average in the 12 new Member States is equivalent to more than 5 per cent of the active population. It should be noted that these countries entered EU and the Common Agricultural Policy after 2000.
The rates of decrease in agricultural labour input in the individual countries range from 2.6% in Greece to 55% in Estonia, where labour input has more than halved in less than 10 years. Generally speaking, the decrease is lowest in the EU-15 countries, with Poland (−11.3%) being an exception. In Portugal, on the other hand, the decrease of 31.6% shows a similar trend to the average decrease in labour input for NMS-12 (−31.3%).
Despite the steep falls recorded in the new Member States, agricultural labour input in these countries in 2009 accounted for a little over half (51.7%) of EU-27 agricultural labour input.
The figures for agricultural labour input are recorded in the Economic Accounts for Agriculture as Non-salaried labour input and Salaried labour input, respectively. Since 2000, non-salaried labour input, which represents the largest share in almost all countries (except the Czech Republic and Slovakia), fell by 28.3% in the EU-27, while the salaried portion decreased only by 9.6%.
Agricultural production and labour input
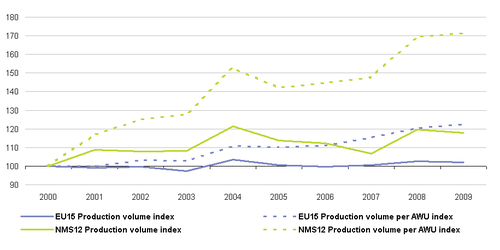
The volume of agricultural production in the EU has remained fairly stable since 2000 according to the indices compiled from the accounts data at constant agricultural prices. The figures show a 4% higher production volume in 2009 than in 2000. As the labour input over the same period decreased by 24.9%, the volume produced per annual work unit has improved significantly.
The EU-15 and the NMS-12 have shown different trends in terms of the volume of output, with a volume for EU-15 that is very stable and a volume for NMS-12 that is growing over time. For NMS-12 the volume has increased by 15% since 2000, based on the average of the indices for 2007-2009.
The differences between the two groups of countries become even clearer when one measures the development in volume per AWU. With this indicator, the EU-15 shows an increase of slightly less than 20% since 2000 - while the increase for NMS-12 is well over 60% since 2000 according to the average indices for 2007-09.
However, the level of output volume produced per annual work unit is still very different between the two groups of EU Member States. As an average for 2007-09 the output in constant agricultural prices (2005 prices) per AWU was 6.4 times higher in the EU-15 than in the NMS-12. Different agricultural products and somewhat lower prices in NMS-12 can explain only a small part of this huge difference in level.
Factor income over labour input
Agricultural labour input has a significant impact on the main indicator (Indicator A) for the Economic Accounts for Agriculture, as the indicator monitors the trend in the real factor income per annual work unit. Figures are available on the Eurostat website.
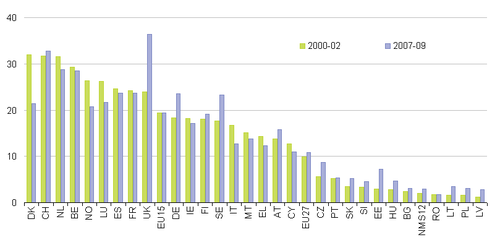
The figure 3 shows factor income in real values (2005 Euro) divided by the agricultural labour input on average for the years 2000-02 and 2007-09, respectively. The results 2000-02 range from over EUR 30 000 per AWU (Denmark, Switzerland and Netherlands) to slightly over EUR 1 000 per AWU (Latvia). The EU-15 countries plus Cyprus, Malta, Norway and Switzerland, but excluding Portugal, show results above the EU-27 average, while all the new Member States from Eastern and Central Europe are below the average, along with Portugal.
The difference between EU-15 and NMS-12 has been smaller since 2000. For 2000-02 the average real factor income per AWU was 9.5 times higher in EU-15 than in NMS-12. As regards the averages for 2007-09 the result in EU-15 was only 6.4 times higher than in NMS-12. The difference for 2007-09 is higher than can be accounted for by the difference in purchasing power.
The smaller difference is mainly due to a significant rise in the factor income per AWU in the new Member States. In the NMS-12 the real factor income per annual work unit rose from around EUR 2 000 per AWU in 2000-02 to around EUR 3 000 per AWU in 2007-09. On average EU-15 showed no significant changes since 2000-02, but the variation among the countries is very high.
This overall increase in factor income per unit of labour input is to a large extent due to the decrease in labour income. If the labour input had remained the same, the EU-15 results would have decreased significantly and the result for NMS-12 would have shown an increase slightly over 10%.
Data source
Estimated results for agricultural income and labour input are submitted by the Member States and EFTA-countries. The implicit GDP-deflator is used for the compiling of the real values. Results from latest year are provisional.
Further Eurostat information
Publications
Database
- Agriculture, see
- Economic Accounts for Agriculture
- Economic accounts for agriculture - values at current prices (aact_eaa01)
- Economic accounts for agriculture - Values at constant prices (2005=100) (aact_eaa03)
- Agricultural Labour Input Statistics
- Agricultural Labour Input Statistics: absolute figures (in 1000 annual work units) (aact_ali01)
- Economic Accounts for Agriculture


