Archive:Marriages and births in Poland
Why marry? Marital status and childbirth in the Netherlands
- Author: Joanna Stańczak, Karina Stelmach, Magdalena Urbanowicz (CSO of Poland)
- Source: all data come from surveys conducted by Central Statistical Office of Poland.
This article on marriages and births is part of a pilot project implemented by Eurostat together with the Member States. The aim of the pilot project is to better reply to user's needs by complementing the Eurostat article presenting data on an EU level with more detailed information on the same topic, but at national level. Articles from the participating Member States are available in the corresponding national languages as well as in English and they form, together with the Eurostat article, an online publication.
Marriage and family are strongly embedded in the value system of contemporary Poles. The article presents brief information about trends concerning the concluding and disintegration marriages as well as the births in the perspective of the past 25 years, i.e. from the moment of economic and social transformation in 1989. The first half of the 90s was the breakthrough period for observed demographic trends. The changes point to the ongoing transformation in the behaviour of young persons, who while entering adulthood and planning a future first invest in themselves - in education, work, and then in the family and its enlargement.
The article also provides information about the structure of the Polish population by de facto marital status.
Main statistical findings
The decrease in the number of marriages in Poland
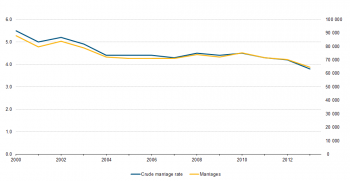
The number of marriages in Poland has been decreasing since 2008 - in 2013, there were over 180 thous. new marriages, i.e. over 23 thous. less than in the previous year and 77 thous. less than in 2008 . The marriage rate was about 4.7‰, while it amounted 6-6.8‰ in 2006-2010. The unfavorable trend in the number of new marriages will probably have the effect of reducing the number of births in subsequent years.
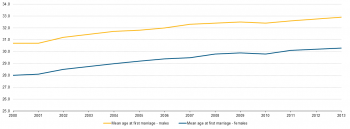
During the period of transformation in Poland, there has been a significant increase in the age of the persons entering into marriage. Men tend to get married before the age of 30 years (this was 29 years of age) and median age of women was about 27 years. At the beginning of the 90’s over half of the married men were below 25 years of age, compared with only about 17% in 2013. The share amount of women below 25 age has decreased respectively from 73% to 34% in 2013. In the last years the age group who tend to get married most often, was not as in previous years group 20-24 but 25-29. The share of this group (both men and women) constitutes nearly 40% (this was 28% in 2000 and nearly 20% in 1990).
Invariably the first marriages constitute about 82% of all newly concluded marriages, i.e. contracted by single (never married) persons. In 2013, median age of single-men was almost 28 years, i.e. over 4 years more than at the beginning of the 90’s (this was 25 years in 2000). Bride was 26 years old compared with 22 years at the beginning of the 90s and more than 23 in 2000.
With the increase in age of get marriage also changed the structure of the educational level of the newlyweds. In 2013 the higher educational level was dominated among brides – over 47% in comparison to 15% in 2000 and only 4% in the 90s. Among men - more than 40% of them had secondary education degree; higher studies were completed by over 33% of brides (compared to 5% for the beginning of the 90's and 13% in 2000).
The presented changes are example of the transformations taking place in the behavior of young people, who are planning a future firstly they try to invest in yourself – in education, work – and then in the family.
The fixed number of divorces
Within the past few decades in Poland, more than 200 thous. of marriages has been dissolving every year - approx. 30% as a result of divorce, and the remaining almost 70% by death. In the 90s of the last century and at the beginning of this century, the proportions were 20 to 80.
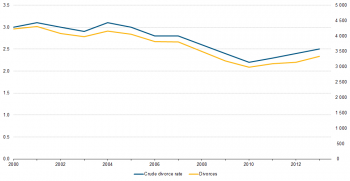
In recent years has been divorced about 65 thous. marriages yearly - in 2013 above 66 thous. couples divorced – about 24 thous. more than in 1990. The divorce rate amounted 1.7‰ vs. 1.1‰ in 1990. In 2013, each 73 of 10 thous. existing marriages were terminated through the court ruling in contrast to less than 50 in the 90s.
On average, divorced spouses have lived together for approx. 14 years (and the duration of their marriage becomes slightly longer). Year by year they are a bit older. In 2013 an average men was about 40-41 years at the time of divorce, women were over 2 years younger.
Constantly in over 2/3 of all cases, it was women who filed for a divorce. The rate of divorces due to woman’s fault was over 3% (18% of all divorced was due to men fault) but in the majority of cases (over 74%) the fault was not adjudicated. The most common causes of divorces which spouses declare is incompatibility of characters (over 1/3 of all divorces), the other causes are infidelity or permanent emotional relationship with another person (1/4 divorces) and alcoholism (19%).
When deciding on custody of the underage children (aged below 18 years) remaining from the divorced marriage the court most often (60% of cases in 2013) grants custody solely to mother. Solely to father only in approx. 5% of cases. In 34% of cases joint custody is granted.
The decrease in number of live births
In Poland about 550 thousand children were born annually in first years of the transformation (the crude birth rate was 10,2-10,6‰). Since 1992, the declining number of births - in 2013 nearly 370 thous. were registered (rate - 9,6‰), i.e. over 16 thous. less than in the previous year and 9 thous. less than in 2002.
Currently, the number of births is almost by half lower compared to the size recorded in the last demographic boom i.e. in the first half of the 80’s of the last century (the crude rate was over 19‰). The number of births – after the decrease which took place immediately after the baby-boom – should grow since the mid-90s of the last century. It would be a natural consequence of the entry into the age of high fertility numerous vintages of women born in the 70's, and then in the early 80's of last century. Meanwhile, the deep depression of the number of births was observed, which lasted until 2003 (born in the 351 thous. children – the fewest in the whole post-war period). In 2004-2009 the number of births has risen to almost 418 thous. the growth was mainly due to the result of realization postponed births. Also an increase in the number and percentage of second and higher order births was recorded. As a result there was a significant increase in the number of mothers aged 30-40 years. The next four years brought a decline in the number of births. Low number of births does not guarantee in Poland – for more than 20 years – a simple generation replacement. Since 1990 remains a period of depression birth and the value of the fertility rate is below 2 (it was 1,99 in 1990) . In 2013, the total fertility rate (TFR) decreased to 1.26.
Increase of the age of women at childbirth
Initiated in the 90s of the last century the demographic transformations caused a shift of the highest female fertility from the group aged 20-24 to the group aged 25-29. They also caused significant increase fertility rate at the age group 30-34, which – as mentioned earlier – is the result of realization of the postponed births. The consequence of all the changes in procreation behaviors (in particular, in the last 10 years) is the increase of the median age of women giving birth to a child. In 2013 this was just over 29 years – compared with 26 years in 2000. During this period the average age of the women giving birth to their first child also increased - from less than 24 years in 2000 to just over 27 years in 2013.
The observed changes are another result of choice, which is often made by young generations of Poles, to reach a certain level of education and economic stability firstly and then (about the age of 30) to start and expand a family.
Over 20% of births in Poland are births outside marriage
The female fertility is definitely predominated by the number of new marriages. Nowadays about 80% of children are born into families created by legal marriages, whereas more than half of marital children are born within the first three years of marriage. Despite of the periodic increase of the number of new marriages (in 1997-2000 and 2005-2008), the percentage of extra-marital births has been increasing for the past several years. In 2000 the extra-marital birth share was about 12% and it was above 23% in 2013. The growing extra-marital birth rate is the results of the growing number of families created by domestic partnership. However, the indicator of extra-marital birth in Poland still remains one of the lowest in Europe.
Structure of population in Poland by the facto marital status
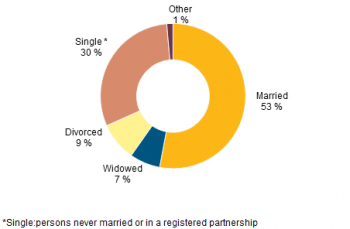
Poland is a country with a strong family tradition which is reflected in the structure of the population by de facto marital status. In 2011 among the population aged 20 and more (this is a population of 30.3 million.) nearly 60% remained legally married; among men, this percentage was over 62%, and among women slightly less - almost 57%. In addition, more than 2% of the population 20+ declared to remain in informal relationships (consensual unions).
The next largest group due to the actual marital status are bachelors and maidens (singles – never married) who together accounted for 22% of the population aged at least 20. In this case clearly it is seen variation by sex, i.e. the percentage of singles among women was less than 18%, and among men up to 27%. The divorced persons are almost 5% of the population aged 20 and more, and remaining in the separation represent less than 1%. The greatest diversity by sex refers to a group of widowed persons that in 2011 accounted for just over 10% of the study population - but widowers among men were just over 3%, while widows accounted for over 16% of women. This diversity deepens as they move to older age groups - in result older men most often for life remain married, and older women are widows.
Census results in 2011 in terms of de facto marital status revealed the actual population structure similar to that obtained in the census from 2002 . Additionally, the changes observed over the years were similar to those of legal marital status. In relation to 2002 the number and proportion (more than 2 percentage points) single men/women, and divorced persons (more than 1 p.p.) increased. Also increased the number of persons declaring to remain in a legal marriage, but decreased their share in the population aged 20 and more. Similarly, the number of widows increased, while the percentage of them remained at a level similar to that recorded in 2002. The biggest change occurred in the case of remaining in consensual unions. The number of partners increased by almost 2/3 (from approx. 392 thousand in 2002 to almost 638 thousand in 2011) - which means an increase in the number of consensual unions by nearly 200 thousand in 2002 to approx. 320 thousand in 2011. However, it is still one of the least numerous groups of de facto marital status. Structure of the population by age in the various categories of de facto marital status are similar to the appropriate structures of legal marital status. The differences between the two categories of marital status are the most significant for those age groups in which is observed increase in the proportion of persons remaining in cohabitation, i.e. for single women and men aged below 40 and 40 and 50-year-old divorced persons. The study of the population remaining in consensual unions in terms of their legal marital status shows that the dominant part - over 61% of relationships - are persons of legal marital status single men / women. The second group are divorced persons (account for nearly 29% of cohabitants), and persons being legally married and widowed represent 5% of the total number of partners. This is undoubtedly related to the age of cohabiting persons. Among persons under 40 partnerships create mainly bachelors and maidens, including - among twenty years old represent 95%, but among thirty years old cohabitants second important group concerns those who are divorced (26%). Divorced persons constitute also more than half of the 40- and 50-year-old female partners and 40- 50- and 60-year-old partners. The older the age group the more - among cohabiting couples - begin to dominate the widows, particularly among women. An analysis of the results of censuses conducted in Poland over several years shows that changes in the population aged 20 and more by marital status are not rapid. Slowly but steadily is decreasing share of married persons - particularly among men, while strongly growing proportion of divorced persons, though - from the point of view of legal marital status - are still the least numerous group. The smallest changes concern widowed persons - their percentage in the total population aged 20 and more remains practically unchanged. On the other hand, in the case of single men and women, their share varies dependent on the baby booms and population declines. In the case of de facto marital status, the number of consensual unions increases.
See also
External links
- Publications

