Archive:The EU in the world - transport
- Data from February 2014. Most recent data: Further Eurostat information, Main tables and Database. Planned article update: May 2015.
This article is part of a set of statistical articles based on Eurostat’s publication The EU in the world 2014.
The article focuses on transport statistics in the European Union (EU) and in the 15 non-EU countries from the Group of Twenty (G20). It provides information on freight and passenger transport, as well as on the stock of passenger cars and gives an insight of the EU’s transport sector in comparison with the major economies in the rest of the world, such as its counterparts in the so-called Triad — Japan and the United States — and the BRICS composed of Brazil, Russia, India, China and South Africa.

(passenger-km per inhabitant) - Source: Eurostat (rail_pa_total) and (demo_gind) and the World Bank (World Development Indicators and Health Nutrition and Population Statistics)

(number per 1 000 inhabitants) - Source: Eurostat (tsdpc340) and the World Bank (World Development Indicators and Health Nutrition and Population Statistics)

(tonne-km per inhabitant) - Source: Eurostat (road_go_ta_tott) and (demo_gind) and the World Bank (World Development Indicators and Global Development Finance)
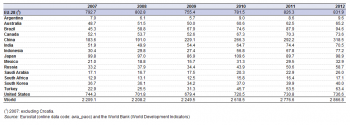
(million) - Source: Eurostat (avia_paoc) and the World Bank (World Development Indicators)
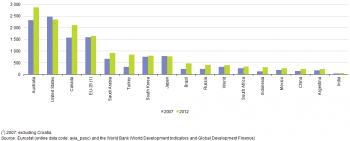
(per 1 000 inhabitants) - Source: Eurostat (avia_paoc) and the World Bank (World Development Indicators and Global Development Finance)
Main statistical findings
Rail transport
Rail passenger and freight transport in G20 members generally higher in 2011 than in 2006
Concerning the use of rail transport (see Figure 1 and Table 1), the G20 members can be split into several groups depending on the extent to which this mode is used for passenger and/or freight transport. Saudi Arabia, Indonesia and to a lesser extent Turkey and Argentina had a relatively low use of rail transport in general. In the United States, Mexico, Canada and Australia, rail transport was focused mainly on freight transport, while passenger transport was dominant in Japan, South Korea and India. A relatively high use of rail transport for both freight and passengers was observed in China, Russia, South Africa and the EU-28.
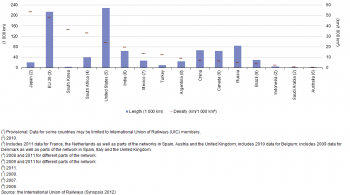
The use made of rail transport is linked to some extent to network access. Figure 2 provides information for the overall length of rail networks in G20 members as well as the density of each network. South Africa, South Korea, the EU-28 and Japan recorded the densest networks, with more than 30 km of line per 1 000 km². Australia and Saudi Arabia had low rail network densities, reflecting to some extent their low population density. However, Indonesia also had one of the lowest rail network densities among the G20 members despite a high population density.
Comparing 2006 with 2011, a particularly large percentage increase in passenger rail services was recorded in Mexico, with smaller but nevertheless large increases also recorded in India, Australia, South Africa, China and Argentina. Rail freight transport in 2011 was higher than it had been in 2006 in most G20 members, notably in Indonesia, Saudi Arabia and India where it increased by at least 40 %. Estimates for the EU-28 show a 9 % increase in rail passenger transport and a 4 % fall in rail freight transport between 2006 and 2011.
Maritime transport
Over one fifth of the goods loaded and unloaded worldwide in 2011 were handled in EU-28 ports
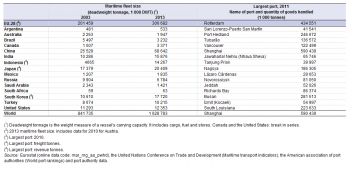
The world’s maritime fleet (see Table 2) increased from 842 million deadweight tonnes (DWT) in 2003 to 1 629 million DWT in 2013, equivalent to average growth of 6.8 % per year. During this period, the maritime fleets of Brazil, Saudi Arabia, Russia and Australia contracted while the other G20 members recorded an expansion, notably in Indonesia, China, Canada, South Korea, India, the EU-28 and Mexico. The EU-28’s maritime fleet grew by 4.3 % per year during this 10-year period and remained the largest among the G20 members in 2013 with 18.8 % of the world total. It should be noted that there are several smaller countries outside of the G20 that accounted for a large share of the world maritime fleet in 2013, notably Panama (21.5 %), Liberia (12.2 %) and the Marshall Islands (8.6 %) — all associated with flags of convenience. The EU plays a leading role in international maritime freight transport.
Road transport
More than 500 cars for every 1 000 inhabitants in 2010 in the EU-28, Japan, Canada, Australia and the United States
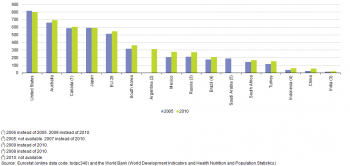
Among the G20 members, reliance on cars for passenger transport was highest in 2010 in the EU-28, Japan, Canada, Australia and the United States — all of which had more than 500 cars for every 1 000 inhabitants; the lowest ratios were recorded in Indonesia, China and India, all below 100 cars for every 1 000 inhabitants. A general upward trend was observed in all G20 members between 2005 and 2010, except for the United States where the ratio fell by 19 passenger cars per 1 000 persons (-2.3 %) over the five-year period under consideration and Japan where the number was stable. In percentage terms, the fastest growth in the ratio of passenger cars to population was recorded in China, as the ratio more than doubled. The number of passenger cars per 1 000 inhabitants also increased strongly in Indonesia, Mexico, Turkey, India and Russia — see Figure 3.
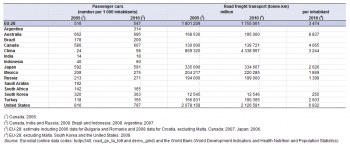
The quantity (tonne-kilometres) of road freight transport was particularly high in Australia relative to the size of its population. It should be noted that the road freight transport indicators presented here are based on the combination of the weight (in tonnes) and the distance (in kilometres) that is transported: the very high figure in Australia therefore reflects not only an extensive use of road freight transport as a mode of freight transport, but also the large distances involved in transporting goods around a large and sparsely populated land area. Road freight transport was notably less common in South Korea than in the other G20 members for which data are available. Comparing 2005 with 2010, the most notable development was the increase in the amount of Chinese road freight: this figure quintupled (see Table 3), increasing at an annual average rate of 37.9 %.
The data available in Tables 1 and 3 allow a comparison of the relative importance of road and rail freight transport among several G20 members; note that the rail transport data are generally one year fresher than the road transport data. The quantity of freight transported by road in Japan and Turkey was approximately 17 times as high as that transported by rail; in the EU-28 the level of road freight transport was 4.2 times as high as rail freight transport, while in Russia, Canada and the United States the amount of rail freight transport exceeded that for road freight.
Air transport
In terms of passenger numbers, the busiest airport in the world was Hartsfield-Jackson Atlanta in the United States
Worldwide, the number of air passengers carried in 2012 was around 2.9 billion, an increase of 3.2 % compared with 2011. In the EU-28, air passenger numbers in 2012 reached 831.9 million, an increase of 0.7 % compared with 2011, and equivalent to 29.0 % of the world total. The United States had 736.6 million passengers (25.7 % of the world total) and China had 318.5 million (11.1 %). Several G20 members recorded a fall in their respective number of air passengers in 2008 and/or 2009, at the peak of the financial and economic crisis. By 2011, air passenger numbers had returned above their pre-crisis 2007 peaks in all G20 members except for the United States; in 2012 passenger numbers in the United States remained 1.0 % below their 2007 level. The situation in Japan was more complicated as the rebound in passenger numbers in 2010 was short-lived as numbers fell again in 2011 in the wake of the earthquake and Tsunami off the coast of Tōhoku. Looking over the period 2007–12, the strongest growth in the number of air passengers was recorded for Turkey, followed by Indonesia and Brazil, all of which saw passenger numbers more than double.
Relative to the size of the population, the number of air passengers in 2012 was highest among the G20 members in Australia, ahead of the United States and Canada, followed by the EU-28, all with more passengers carried than the overall size of their populations (see Figure 5). By contrast, India recorded by far the lowest number of air passengers relative to its overall population size.
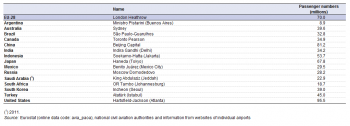
In terms of passenger numbers, the busiest airport in the world in 2012 was Hartsfield-Jackson Atlanta in the United States, with 95.5 million passengers, followed by Beijing Capital airport in China with 81.2 million and London Heathrow in the United Kingdom with 70.0 million, making Heathrow the busiest passenger airport in the EU-28.
Data sources and availability
The statistical data in this article were mainly extracted during February 2014. The indicators are often compiled according to international — sometimes global — standards. Although most data are based on international concepts and definitions there may be certain discrepancies in the methods used to compile the data. Data concerning ports have been extracted from the World port rankings of the American Association of Port Authorities. Data concerning airports have been compiled from information available from individual airports, regional or national civil aviation authorities.
EU data
Most if not all of the indicators presented for the EU have been drawn from Eurobase, Eurostat’s online database. Eurobase is updated regularly, so there may be differences between data appearing in this publication and data that is subsequently downloaded.
G20 countries from the rest of the world
For the 15 G20 countries that are not members of the EU, the data presented have generally been extracted from a range of international sources, most notably the World Bank, the United Nations Conference on Trade and Development, the World Bank and the International Union of Railways. For some of the indicators shown a range of international statistical sources are available, each with their own policies and practices concerning data management (for example, concerning data validation, correction of errors, estimation of missing data, and frequency of updating). In general, attempts have been made to use only one source for each indicator in order to provide a comparable analysis between the countries.
Context
An efficient and well-functioning passenger and freight transport system is often viewed as being vital for business and individuals. Some of the key issues related to transport are its environmental impact, efficiency and safety. This article presents transport statistics on the weight of freight and number of passengers that are moved, as well as providing some information on the stock of passenger cars. The level of transport, in particular international transport, can be related to a wide variety of issues, including trade liberalisation, globalisation, higher motorisation rates and tourism.
See also
- All articles on the non-EU countries
- All articles on Transport
- Other articles from The EU in the world
Further Eurostat information
Publications
- Energy, transport and environment indicators — 2013 edition
- Key figures on the enlargement countries — 2014 edition
- Pocketbook on Euro-Mediterranean statistics — 2013 edition
- The EU in the world 2013
- The European Union and the BRIC countries
- The European Union and the African Union — 2013 edition
- The European Union and the Republic of Korea — 2012
Main tables
- Transport, see:
- Road transport (t_road)
- Motorisation rate (tsdpc340)
Database
- Transport, see:
- Railway transport (rail)
- Railway transport measurement - passengers (rail_pa)
- Railway transport - Total annual passenger transport (1 000 pass., million pkm) (rail_pa_total)
- Railway transport measurement - Goods (detailed data based on Directive 80/1177/EC or Regulation (EC) 91/2003) (rail_go)
- Railway transport - Goods transported, by type of transport (1 000 t, million tkm) (rail_go_typeall)
- Railway transport measurement - passengers (rail_pa)
- Road transport (road)
- Road freight transport measurement (road_go)
- Total road freight transport (road_go_tot)
- Summary of annual road freight transport by type of operation and type of transport (1 000 t, Mio Tkm, Mio Veh-km) (road_go_ta_tott)
- Total road freight transport (road_go_tot)
- Road freight transport measurement (road_go)
- Maritime transport (mar)
- Maritime transport - main annual results (mar_m)
- Top 20 ports - Gross weight of goods handled in each port, by direction (mar_mg_aa_pwhd)
- Maritime transport - goods (mar_go)
- Maritime transport - Goods (gross weight) - Annual data - All ports - by direction (mar_go_aa)
- Maritime transport - main annual results (mar_m)
- Air transport (avia)
- Air transport measurement - passengers (avia_pa)
- Overview of the air passenger transport by country and airports (avia_pao)
- Air passenger transport by main airports in each reporting country (avia_paoa)
- Overview of the air passenger transport by country and airports (avia_pao)
- Air transport measurement - passengers (avia_pa)
- Population (populat), see
- Demography (pop)
- Demography - National data (demo)
- Demographic balance and crude rates (demo_gind)
- Demography - National data (demo)
Dedicated section
Source data for tables and figures (MS Excel)
External links
- American association of port authorities
- European Commission
- International Union of Railways
- United Nations Conference on Trade and Development
- World Bank