Archive:Population projections
- Data from June 2008, most recent data: Further Eurostat information, Main tables and Database.
This article looks at Eurostat’s latest population projection scenario (EUROPOP2008, the convergence scenario) for the 27 Member States of the European Union (EU) and two non-EU countries, Norway and Switzerland. Population projections are what-if scenarios that aim to provide information about the likely future size and structure of the population. The European Commission uses the results to analyze the impact of ageing populations on public spending.
Main statistical findings
Highlights
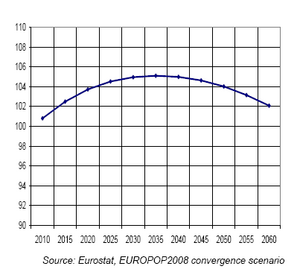
- The 2008-based national population projections (EUROPOP2008 convergence scenario) show the EU population rising gradually from 495.4 million in 2008, to a peak of 520.7 million in 2035. Thereafter, it will decline gradually to 505.7 million on 1 January 2060.
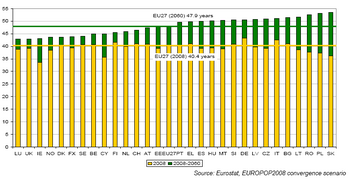
- The EU population is projected to become older with the median age rising from 40.4 years in 2008 to 47.9 years in 2060.
- The share of people aged 65 years or over in the total EU population is projected to increase from 17.1 % to 30.0 %. And the number of 65 year olds is projected to rise from 84.6 million in 2008 to 151.5 million in 2060. Similarly, the number of people aged 80 years or over is projected to almost triple from 21.8 million in 2008 to 61.4 million in 2060.
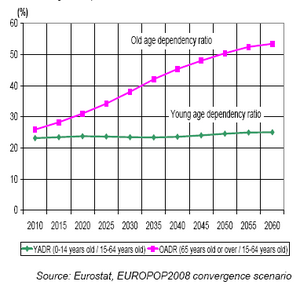
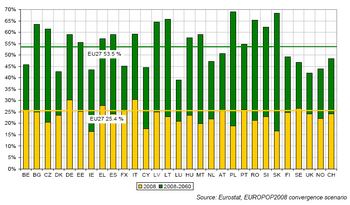
- The young-age-dependency ratio for the EU population is projected to rise moderately to 25.0 % in 2060, while the old-age-dependency ratio is expected to increase substantially from its current levels of 25.4 % to 53.5 % in 2060 (see Graph 2).
- Whereas, in 2008 there were four people of working age (15-64 years old) for every EU citizen aged 65 years or over, by 2060 the ratio is expected to drop to 2 to 1.
Countries will follow different paths
Although the EU population is likely to be 2.1 % higher on 1 January 2060 compared to 2008 (see Graph 1), there will be a considerable variation among Member States. Fourteen Member States are projected to have a smaller population on 1 January 2060 than 2008 (see Graph 3). From these countries, those that are projected to show a falling population over the whole period (2008-2060) are Bulgaria, Latvia, Lithuania, Romania,Poland, Estonia and Hungary.
The two non-EU countries, Norway and Switzerland, are projected to have a higher population on 1 January 2060 than in 2008. They are part of a group of countries whose total populations are projected to follow a continuously rising path over the whole projection period, these are Cyprus, Ireland, Luxembourg, Norway, United Kingdom, Switzerland, Sweden, Metropolitan France, Belgium and Denmark
In 2060, when compared to 2008, the changes in the total population are projected to have a moderate impact on the Member States’ shares of the EU population.
Population ageing is a common process
The population is projected to become older in all Member States, Norway and Switzerland (see Graph 4). Thus, the median age of the total population is likely to increase in all these countries without exception. This is due to the combined effect of the existing age structure of the population, persistently low fertility, and a growing number of people who are living longer.
Between 2008 and 2060, the median age is projected to increase by more than 15 years in Poland and Slovakia. In contrast, the median age is projected to increase by less than five years in Luxembourg, the United Kingdom, Denmark, Metropolitan France, Sweden, Belgium and Finland.
The ageing process is also visible in the age structure of the projected population. The share of the population aged 65 years or over is projected to increase in all countries. It should be noted that the projected increase of less than 10 percentage points only applies to six countries.
In particular, for all countries, the population of those aged 80 years or over is projected to increase in both relative and absolute terms. Population pyramids are graphs that show the age and sex distribution of a population (usually at every age or year of birth). Each horizontal bar corresponds to the share of the population at that age, and that sex, in the total population. The EU population continues to age. The 2008 population pyramid appears with bulges in its sides due to the baby boomer groups of the 1960s, which are significant on account of their size (see Graph 5).
In the coming decades, the high number of ageing baby boomers will swell the number of elderly. Thus, this population pyramid for the EU projects that the baby boomer bulge will move up while both the middle part (those of working age, aged 15-64) and the pyramid's base (the young, aged 0-14) will narrow considerably by 2060.
Future trends in age-dependency ratios
Age-dependency ratios are used as indicators of the support levels that the young (14 years or under) or the old (65 years or over) will require from the working age population (conventionally 15-64 years old). They are expressed in terms of the size of either the young-, or the old-age population, relative to the size of the working-age population.
In 2060, for the whole EU, the working-age population is projected to be smaller by almost 50 million people compared to 2008. Over the same period, the population aged 65 years or over is projected to increase by almost 67 million people. As a result, the old-age-dependency ratio in 2060 for the EU is projected to be more than double its current level. This will mean an increase of 28.1 percentage points by 2060.
Two-thirds of the countries are expected to suffer a decrease in their working age population, although the drop will not be the same in every country. In 2060, combined with a general increase in those people aged 65 years or over, the old-age dependency ratio will vary among countries by almost 30 percentage points from the lowest to the highest; in 2008, the difference was 14 percentage points (see Graph 6). Therefore, although this dependency ratio will increase for the whole group, individual countries will be affected differently. In 2008, the old-age dependency ratio in the new Member States that joined the EU in 2004 and 2007, is relatively lower or much lower than it is in the entire EU.
By 2060, all new Member States, with the exception of Cyprus, are projected to have greater increases in old-age dependency ratios than the 28.1 % projected for the whole EU. Thus, these new countries are expected to have old-age dependency ratios that will be among the highest of all in the Member States, Norway and Switzerland. In contrast, the young-age dependency ratio is expected to follow a path with only small changes for all these countries, either (slightly) positive or negative. It is not expected to decrease significantly because the working-age population – the parents’ generation – will shrink as well. The maximum increase is projected for Slovenia (+4.0 percentage points) with the maximum decrease projected for Slovakia (-0.7 percentage points). So, the path, which the total-age-dependency ratio follows, will be shaped by the prevailing rise in the old-age dependency ratio for all countries.
Future trends in births, deaths and migration
As a result of below-replacement fertility for all countries, there are fewer women who reach the reproductive age. This will result in fewer births than in the past.
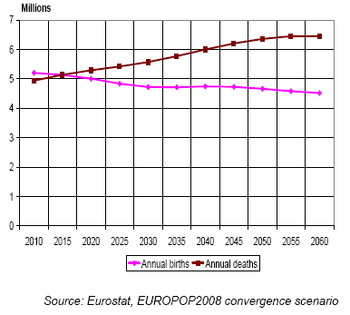
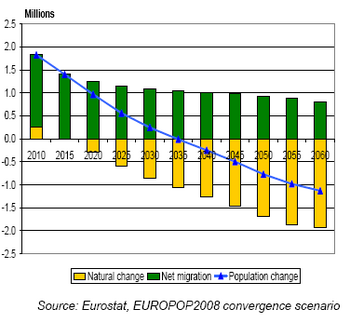
Thus, for the EU, the annual number of births is projected to decrease in 2008-2060 (see Graph 7). At the same time, the annual number of deaths is projected to continue rising. From 2015, it is projected that there will be less births than deaths and, hence, population growth due to natural increase will end. For this reason, positive net migration will be the only population growth factor. However, in the long run, increasing migration will not be sufficient to compensate for this negative natural (population) change (see Graph 8).
Data sources and availability
Eurostat produces population projections every three. The latest set of population projections, EUROPOP2008 “convergence scenario”, is based on the population on 1 January 2008. The assumptions have been developed using the concept that the socio-economic and cultural differences among EU Member States would disappear in the long run. If the narrowing of differences concern the demographic drivers, then this assumption implies a convergence of demographic values. So, in 2150, fertility levels are assumed to converge to those achieved by Member States that are leading the demographic transition or fertility drop. Increases in life expectancy are assumed to be greater for countries at (currently) lower levels and smaller for those at (currently) higher levels, thus they all follow convergent paths in life-expectancy trends. In 2150, net migration is assumed to converge to zero. And, migration in each country has been adjusted upwards when the working age population, having taken into account the converging migration, presents a deficit for the respective projection years.
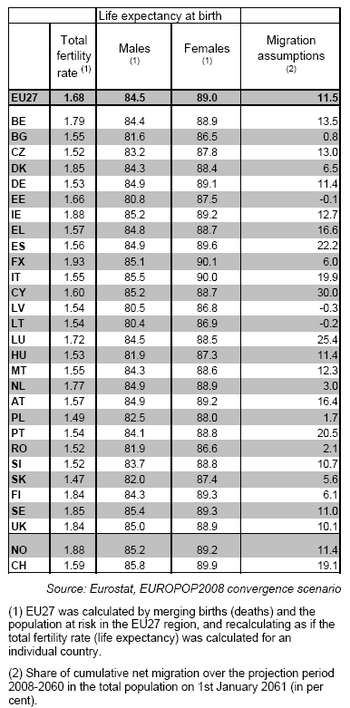
These assumptions can be summarized by means of indicators such as total fertility rate, life expectancy at birth and net international migration for the target year 2060. The latter is expressed as the share of the cumulative net migration over the whole projection period 2008-2060 in the total population on 1 January 2061. Alternative assumptions under a different concept as, for example, the trend scenario, would yield different results.
Remarks on the starting population
The population at 1 January 2008 is based on the latest available estimates produced :
- either by the national statistical institutes (for BE, BG, DK, DE, ES, FX, IT, CY, HU, NL, AT, PL, PT, SI, FI, SE, UK, NO and CH; see Country codes)
- or using the latest Eurostat population forecasts (for CZ, EE, IE, EL, LV, LT, LU, MT, RO and SK).
Thus, minor differences might be observed in data released from official sources at a later date.
Context
Population projections are what-if scenarios that aim to provide information about the likely future size and age structure of the population. Eurostat’s latest population projections scenario (EUROPOP2008 convergence scenario) is one of several possible population-change scenarios based on assumptions for fertility, mortality and migration.
In particular, the assumptions have been developed under the concept of convergence of demographic values as a result of decreasing socio-economic and cultural differences among the EU Member States, Norway and Switzerland.
The current scenario is primarily used for the European Commission’s analysis of the impact of ageing populations on public spending.
Over the last decades, population projections have raised concerns about the consequences of an ageing population. Life expectancy is increasing, fertility rates are falling and the baby boom generation is starting to retire. These facts have led to a debate on how European countries will cope with the changed age structure and its impact on public finances, employment, economic growth and other policy areas.
In particular, the European Commission’s Directorate-General for Economic and Financial Affairs (DG ECFIN) analyzes the impact of ageing populations on public expenditure. More precisely, the DG makes projections of different categories of public expenditure which are affected by the ageing of populations, such as pensions, healthcare and long-term care.
The population projections are a key input for the assessment of the long-term sustainability of public finances across Member States. The DG has released the "Economic and budgetary projections for the EU-27 Member States (2008-2060)-The 2009 Ageing Report".
In addition, the Directorate-General for Employment, Social Affairs and Equal Opportunities (DG EMPL) is addressing the major economic, budgetary and social challenges posed by an ageing society with a renewed strategy for tackling Europe's demographic challenge. In this context, DG EMPL has released a Communication to the European Parliament, the Council, the European Economic and Social Committee and the Committee of the Regions entitled "Dealing with the impact of an ageing population in the EU (2009 Ageing Report)".
Further Eurostat information
Publications
- Ageing characterizes the demographic perspectives of the European societies - Statistics in focus 72/2008
- Work session on demographic projections (jointly by Eurostat and UNECE)
Main tables
- Population (t_popula), see:
- Population projections (t_proj)
- Population projections (tps00002)
- Projected old-age dependency ratio (tsdde511)
Database
- Population (populat), see:
- Population projections (proj)
- EUROPOP2008 - Convergence scenario, national level (proj_08c)
- EUROPOP2008 - Convergence scenario, regional level (proj_r08c)
Dedicated section
Other information
- Commission Green Paper (COM(2005) 94 final) "Confronting demographic change: a new solidarity between the generations”
- Commission Communication (COM(2006) 571 final) "The demographic future of Europe – from challenge to opportunity"
- The 2009 Ageing Report - Economic and budgetary projections for the EU Member States (2008-2060)
- Commission Communication (COM(2009) 180/4) dealing with the impact of an ageing population in the EU (2009 Ageing Report)
