Archive:Enlargement countries - international trade in goods statistics
- Data from September 2012. Most recent data: Further Eurostat information, Main tables and Database.
This article is part of an online publication based on the pocketbook Key figures on the enlargement countries – 2013 edition[1] and focuses on the structure and evolution of the external trade in goods in the enlargement countries of the European Union (EU). Both imports and exports are covered. It also provides information on the trade balance and a breakdown by selected product groups. A number of figures for international trade in goods have been aggregated (as a share of GDP) for the EU-27 and for selected enlargement countries.
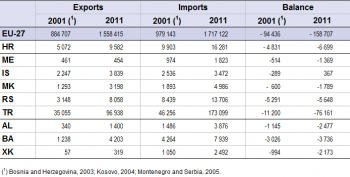
Source: for the EU-27, Eurostat (ext_lt_intertrd); for the enlargement countries, Eurostat (cpc_etmain)
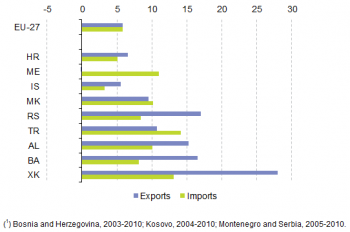
Source: for the EU-27, Eurostat (ext_lt_intertrd); for the enlargement countries, Eurostat (cpc_etmain)
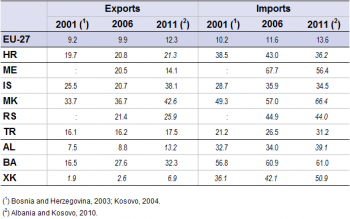
Source: for the EU-27, Eurostat (ext_lt_intertrd) and (nama_gdp_c); for the enlargement countries, Eurostat (cpc_etmain) and (cpc_ecnagdp)
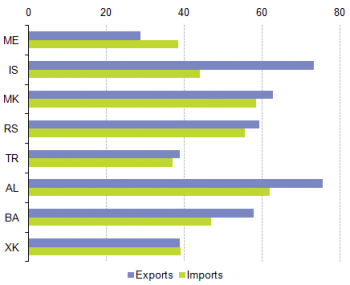
Source: Eurostat (cpc_etflow)
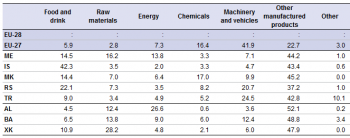
Source: for the EU-27, Eurostat (ext_lt_intertrd); for the enlargement countries, Eurostat (cpc_etsitc)
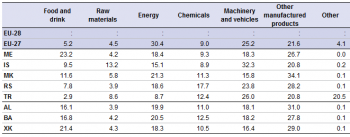
Source: for the EU-27, Eurostat (ext_lt_intertrd); for the enlargement countries, Eurostat (cpc_etsitc)
Main statistical findings
Deficits in external trade in goods in all of the enlargement countries, except Iceland
Despite the global financial and economic crisis that affected most economies from the second half of 2008 onwards, the total value of the goods exported in 2011 by the EU-27 to the rest of the world was 76 % higher than in 2001 (see Table 1). In the past years, almost every enlargement country, except Montenegro (virtually no change) and Iceland (+70 %), saw the value of their exports grow substantially faster than that of the EU-27: the value of Albania’s exports increased four-fold, that of Bosnia and Herzegovina more than three-fold. Admittedly, starting off at a very low level in absolute terms, Kosovo’s [2] value of exported goods in 2011 was five to six times that of 2004. As regards the biggest exporting country in values – Turkey – its exports more than doubled over the decade and reached roughly three times the value of exports of all the other enlargement countries combined in 2011.
The total value of EU-27 imports of goods increased nearly as fast as that of the exports: +75 % between 2001 and 2011. Whereas the value of imports increased less strongly in Croatia (+64 %), Serbia (+62 % between 2005 and 2011) and Iceland (+37 %), the remaining enlargement countries recorded rises well above the EU-27’s value. In this context, the most noticeable change concerns Turkey where the imports increased nearly four-fold (+274 %).
When focusing on the trade balance, Iceland was the only enlargement country registering a surplus in the trade of goods in 2011 (amounting to EUR 367 million). All the other enlargement countries recorded trade deficits, as did the EU-27. Expressed as a percentage of the total trade volume (value of exports and imports combined), the EU-27 deficit in goods trade in 2011 was just below 5 % of the total trade volume, with a slight decrease compared to 2001. Most of the enlargement countries recorded far higher goods trade deficits in relative terms. Indeed, the figures for the enlargement countries (except Iceland) ranged from a trade deficit of 22 % (the former Yugoslav Republic of Macedonia) to 77% (Kosovo). The most important changes over time were observed in Bosnia and Herzegovina (-24 percentage points between 2003 and 2011) as well as in Serbia (-20 percentage points between 2005 and 2011). On the other hand, the deficits in Montenegro grew from almost 36 % in 2005 to 60 % in 2011, while those of Turkey from 14 % in 2001 to 28 % in 2011.
As an indicator of the relative importance of trade in an economy, the figures of imports and exports are often expressed as a proportion of the gross domestic product (GDP) – see Table 2. Using this indicator, the total EU-27 exports of goods corresponded to 12 % of the gross domestic product (GDP) in 2011. Among the enlargement countries, only Kosovo recorded a lower value with less than 7 %. In all the other enlargement countries, the amount of exports expressed as a percentage of the GDP exceeded the EU-27 figure, with the most noticeable figures recorded in the former Yugoslav Republic of Macedonia (43 %), Iceland (38 %) and Bosnia and Herzegovina (32 %).
Imports of the EU-27 corresponded to 14 % of the EU-27 GDP in 2011. In contrast, the enlargement countries recorded far higher proportions. Indeed, all of them saw figures higher than 30% in 2010 or 2011, with peaks in the former Yugoslav Republic of Macedonia (66 %) and Bosnia and Herzegovina (61 %).
The main trading partner for the enlargement countries
The EU-27 has long been the main trading partner for the enlargement countries. According to the latest data available, over 75 % of Albanian and Icelandic exports went to the EU-27. Even the countries with the lowest rates in this category, recorded in Kosovo and Turkey, were around 45 %. Looking at imports, Kosovo and Montenegro received less than 40 % of the total value of imports from the EU-27, whereas in Albania and Croatia this share amounted to over 60 %.
The EU as the main trading partner for the enlargement countries
The EU is the main trading partner for the enlargement countries, but to various degrees. According to the most recent data available, over 70 % of all goods exported by both Iceland and Albania were destined for the EU-27 (see Figure 2). All the other enlargement countries also exported more than half of their goods to the EU, except Turkey and Kosovo which stood slightly below this threshold (46 % and 43 % respectively).
As regards imports of goods, the domination of the EU-27 is slightly less overwhelming: whereas more than 60% of the imports of goods in Croatia and Albania originated from the EU in 2011, this share did not reach 40 % in Montenegro, Turkey and Kosovo. In the same reference year, the other four enlargement countries recorded figures between 45 % and 55 %.
Marine products of prime importance for Icelandic exports
Manufactured goods excluding machinery and vehicles (‘other manufactured products’ in Table 3) made up by far the largest category of exports for all the enlargement countries in 2011, the only exception being Croatia (28 %). Indeed, this category of products accounted for 43 % to 55 % of all goods exports by the eight other countries, far above what was recorded for the EU-27 (23 %). The majority of products exported by the European Union in 2011 concerned Machinery and vehicles, which represented 42 % of total exports, a situation which was, to a lesser extent, similar in Croatia (30 %).
Quite noticeable is the high share of ‘Food and drink’ registered by Iceland which represented 41 % of the total value of all goods exports. Indeed, all of these goods are marine products, primarily demersal fish products (mainly cod, mackerel and haddock). Demersal fish products alone were responsible for 22 % of the total value of Icelandic exports (data not shown).
‘Manufactured goods’ excluding machinery and vehicles’ was also the category which generally had the highest share in the total imports (see Table 4). Most of the enlargement countries registered about 30 % of their imports as falling into this category in 2011. Exceptions concern Iceland and Turkey, where the share of imports of machinery and vehicles exceeded that of the above mentioned category (30 % and 28 % respectively). At EU level, ‘machinery and vehicles’ ranked second in the share of total imports with 26 % behind ‘energy products’, which accounted for 28 % of the total EU imports in 2011.
Data sources and availability
The annual questionnaires sent to the enlargement countries, as well as COMEXT, which is the Eurostat database containing detailed international trade data for the EU and its Member States, are the source of international trade statistics. International trade statistics are normally recorded by enlargement countries on the basis of customs declarations submitted by the trader when clearing customs. The statistics on international trade were extracted from Eurostat free dissemination database Easy Comext, which provides access not only to both recent and historical data from the EU Member States and enlargement countries, but also to statistics of a significant number of third countries. The aggregated data on international trade and the detailed statistics which are disseminated from the Eurostat website are compiled from the COMEXT data on a monthly basis. Note that because COMEXT is updated on a daily basis, data published on the Eurostat website may sometimes temporarily differ from the data stored in COMEXT.
Context
Trade statistics are of prime importance for both public and private users, as they provide valuable information on the current trends in the exchange of goods within a specific geographical area as well as between geographical areas. Moreover, they enable the EU to prepare multilateral and bilateral negotiations on a common trade policy. Furthermore, international trade statistics support European businesses in their market surveys and improve their competitiveness.
The context in which trade statistics are collected has changed radically in recent years, not only within the European Union but also in enlargement countries. The economic impact of globalisation has had its effect on trade, as well as on the financial flows and the movement of persons linked to cross-border economic activity. In view of the enlargement process of the European Union and taking into account the importance of trade for the candidate and potential candidate countries, as well as for ENP countries, the EU has been facing an unprecedented demand for high quality trade statistics to support EU policy decision-making.
See also
- Enlargement countries - statistical overview - online publication
- International statistical cooperation - online publication
Further Eurostat information
Publications
- Key figures on the enlargement countries – 2013 edition
- Enlargement countries - International trade - 2013 edition
Database
- International trade (cpc_et)
- International trade long-term indicators (ext_lti)
- International trade short-term indicators (ext_sti)
- International trade detailed data (detail)
Dedicated section
External links
Notes
- ↑ This article is based on the publication “Key figures on the enlargement countries – edition 2013” prepared when Croatia (HR) was an acceding country, to become a Member State of the European Union (EU) on 1 July 2013.
- ↑ This designation is without prejudice to positions on status, and is in line with UNSCR 1244 and the ICJ Opinion on the Kosovo declaration of independence.