Archive:Europe 2020 indicators - education
Data from July 2013. Most recent data:.
This article is part of a set of statistical articles based on the Eurostat publication Smarter, greener, more sustainable? - Indicators to support the Europe 2020 strategy. It provides recent statistics on education in the European Union (EU), a key area of the EU's Europe 2020 strategy.
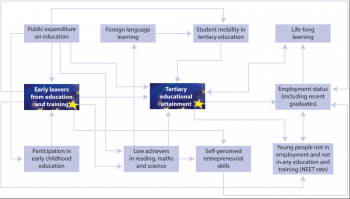
The analysis below hightlights two important indicators: the young people who leave education and training prematurely, thus risking serious and persistent problems on the labour market through a lack of crucial skills; and tertiary educational attainment, providing highly skilled human capital and underpinning research and innovation (see the article on research and development).These indicators include early childhood education, basic reading, maths and science skills and adult participation in life-long learning. The benchmarks are listed in Box 4.1.
The presentation of the headline and contextual indicators follows the typical educational pathway. It starts with early childhood education, followed by acquisition of basic skills (reading, maths and science) and foreign languages, leading to tertiary education and life-long learning in adulthood. The analysis then switches to the ‘outcome’ side. Here it looks at educational attainment in the EU labour force and the impacts of low levels of attainment. Last, the input into the education system, in the form of public expenditure on education, is investigated.
The EU’s education targets are interlinked with the other Europe 2020 goals: higher educa-tional levels help employability and progress in increasing the employment rate in turn helps to reduce poverty [1]. The tertiary education target is furthermore interrelated with the research and development (R&D) and innovation target. Investments in the R&D sector will raise demand for highly skilled workers (see the ‘Research and development’ chapter on p. 49).
(% of population aged 18 to 24 with at most lower secondary education and not in further education or training)
Source: Eurostat online data code (t2020_40)
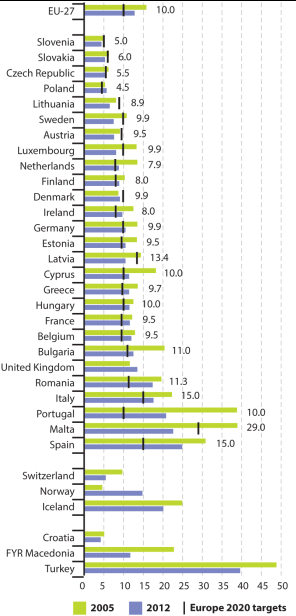
(% of the population aged 18 to 24 with at most lower secondary education and not in further education or training)
Source: Eurostat online data code (t2020_40)
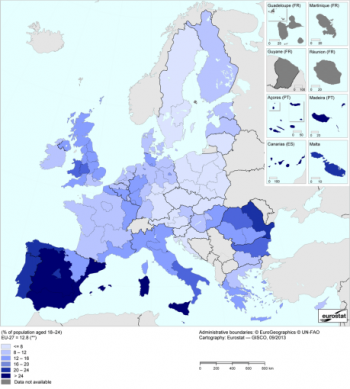
(% of population aged 18 to 24)
(edat_lfse_16)
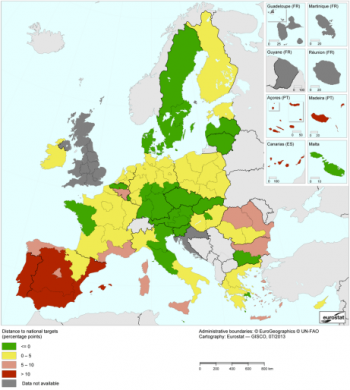
(% of population aged 18 to 24)
(edat_lfse_16)
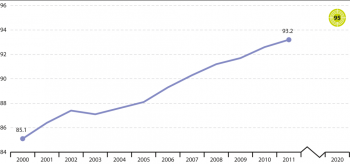
(% of the age group between 4 years old and the starting age of compulsory education)
Source: Eurostat online data code (tps00179)
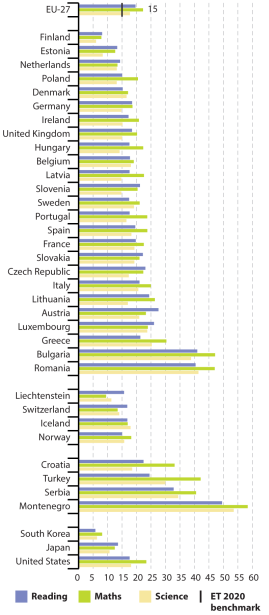
(share of 15-year-old pupils who are below proficiency level 2 on the PISA scales for reading, maths and science)
Source:OECD/PISA, Eurostat online data code (t2020_30)

(% of the population aged 30 to 34 with completed tertiary education (ISCED levels 5 and 6))
Source: Eurostat online data code (t2020_41)

(% of the population aged 30 to 34 with completed tertiary education (ISCED levels 5 and 6))
Source: Eurostat online data code (t2020_41)
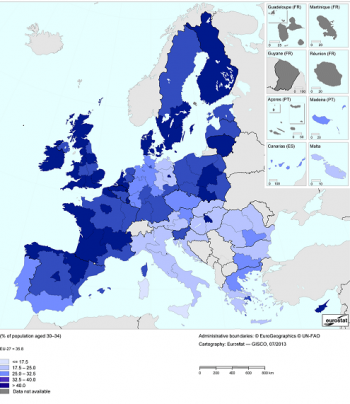
(% of population aged 30 to 34)
Source: Eurostat online data code (edat_lfse_12)

(% of population aged 30 to 34)
Source: Eurostat online data code (edat_lfse_12)
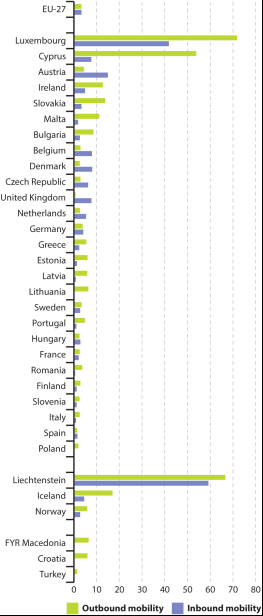
(outbound: students (ISCED 5–6) studying in another EU-27, EEA or candidate country as % of all students; inbound: inflow of students (ISCED 5–6) from EU-27, EEA and candidate countries as % of all students in the country)
Source: Eurostat online data code (educ_thomb)
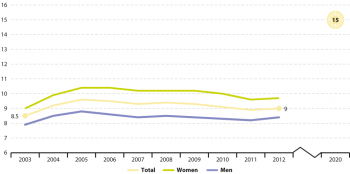
(% of population aged 25 to 64)
Source: Eurostat online data code (tsdsc440)
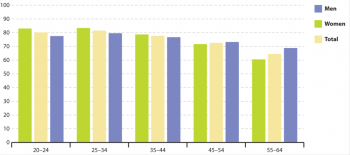
(% of population)
Source: Eurostat online data code (edat_lfse_08)
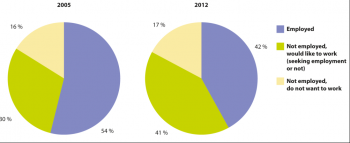
(% of the population aged 18 to 24 with at most lower secondary education and not in further education or training)
Source: Eurostat online data code (edat_lfse_14)
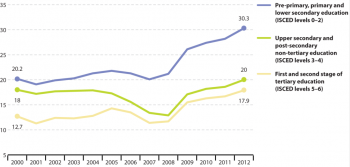
(% of the economically active population aged 15 to 24)
Source: Eurostat online data code (lfsa_urgaed)
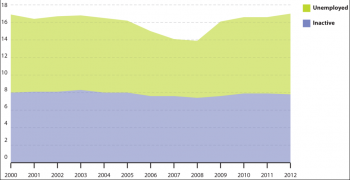
(% of population aged 18 to 24)
Source: Eurostat online data code (edat_lfse_20)
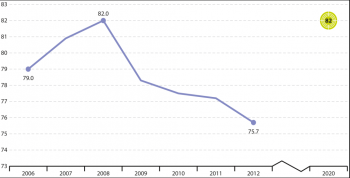
(share of employed graduates (20 to 34 years old) having left education and training in the past three years)
Source: Eurostat online data code (edat_lfse_24)

(% of GDP)
Source: Eurostat online data code (educ_figdp)
Main statistical findings
Early leaving from education and training is declining
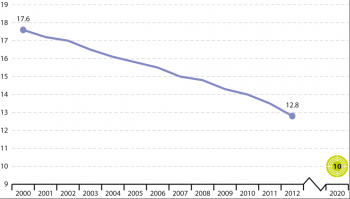
The headline indicator ‘Early leavers from education and training’ shows the share of the population aged 18 to 24 with at most lower secondary education and not in further education or training. This indicator refers to people who failed and dropped out of school and those who did not fail but left education without continuing. Figure 4.2 indicates that since 2000 the share of early leavers from education and training has fallen continuously in the EU. This trend mirrors reductions in almost all EU Member States for both men and women.
Young men, migrants and ethnic minorities leave education and training earlier
In the EU as a whole, rates of early leaving from education and training are about 30 % higher for men than for women. Since 2000, this gap has only closed slightly. Bulgaria was the only EU Member State in 2012 where men were more likely to reach upper secondary graduation. A similar situation could be observed in the candidate countries Turkey and FYR Macedonia [2]. In all other EU Member States men were more likely to leave earlier. Gender differences were particularly strong in Cyprus, Latvia, Poland, Estonia and Luxembourg. In these countries, early leaving from education and training was twice as high (or even higher) for men than for women.
Similarly, young migrants have a higher tendency to abandon formal education prematurely. In the EU, the share of early leavers from education and training among those foreign-born is more than twice as high as for natives (25.6 % compared to 11.6 %) [3]. Language difficulties leading to underachievement and lack of motivation are one possible reason. Lower socioeconomic status of migrants increasing the risk of social exclusion [4] is another. Educational systems may also exacerbate these circumstances if they are not set up to respond to the special needs of pupils from vulnerable groups [5].
In a number of Member States the proportion of pupils dropping out early or even not attending school at all is especially high among ethnic minority groups, such as Roma. In 2011 more than 10 % of Roma children were not attending compulsory education in Romania, Bulgaria, France and Italy. This figure reached 35 % in Greece [6].
Ethnic minorities are likely to be excluded from education due to a combination of factors including parental choices, poverty, discriminatory practices, residential segregation and language barriers [7]. In response to persistent marginalisation and social exclusion of Roma minorities, the European Commission in 2011 adopted the ‘EU Framework for national Roma integration strategies up to 2020’ [8]. The framework reflects the EU’s commitment to ensuring Roma inclusion in four key areas, including access to education.
Early leaving from education and training highest in Southern Europe
Reflecting different national circumstances, the common EU target for early leavers from education and training has been translated into national targets by all Member States except the United Kingdom [9]. National targets range from 4.5 % for Poland to 29 % for Malta. In 2012, ten countries had already achieved their targets: Austria, the Czech Republic, Denmark, Lithuania, Luxembourg, Latvia, Malta, Sweden, Slovenia and Slovakia. Portugal and Spain were the furthest away by some 10 percentage points.
In 2012 early leaving from education and training rates varied by a factor of five across EU Member States. The lowest proportion of early leavers could be observed in Slovenia, Slovakia, the Czech Republic and Poland as well as in Croatia with less than 6 %. The share was highest in Spain, Malta, Portugal, Italy and Romania, with more than 17 %.
At the same time Southern European countries experienced the strongest falls in early leaving from education and training over the period 2005 to 2012, especially Portugal (– 46.4 %), Malta (– 41.9 %), Cyprus (– 37.4 %) and the Netherlands (– 34.8 %). In 2012, 21 EU Member States showed early leaving rates below the EU average of 12.8 %, and 12 were already below the overall EU target of 10 %.
Looking at the European Free Trade Association (EFTA) and candidate countries, Switzerland was on a level with the best performing EU Member States, whereas the share of early leavers from education and training was above the EU average in Norway, Iceland and in particular in Turkey.
Divergence in the incidence of early leaving from education and training across Member States is also mirrored in the regional dispersion of the indicator (see Map 4.1). The predominance of regions with a very low share of early school leavers in some Eastern European countries such as Slovenia, Slovakia, the Czech Republic and Poland corresponds to their overall low proportion of students discontinuing education early. In stark contrast, regions in Spain and Italy stand out with their above average rates of early leavers from education and training.
In 2012, Belgium, Bulgaria and Spain showed the biggest within-country dispersion of early leaving rates, with a factor of two or above. This means that the worst performing regions in these countries had early school leaving rates that were about two times the rates of the best performing regions. In contrast, Sweden and the Netherlands were the most ‘equal’ countries, showing almost no difference for this indicator.
Map 4.2 shows the distance of regions (at NUTS 1 level) to the respective national Europe 2020 targets. The observed geographical variations across countries are translated into regional disparities in terms of distance to the respective national headline targets. Most notably, for Spain the large gap to the national target is common for almost all regions.
Starting early
Early childhood education and care is improving
Early childhood education and care (ECEC) can bring wide-ranging social and economic benefits for individuals and for society as a whole. Quality ECEC provides an essential foundation for effective life-long learning and future educational achievements. It also helps personal development and social integration.
Participation in ECEC is considered a crucial factor for socialising children into formal education. This is especially important for children from more disadvantaged backgrounds. The aim is to reduce the incidence of early school leaving, addressing one of the Europe 2020 headline targets on education. Investment in pre-primary education also offers higher medium- and long-term returns and is more likely to help children from low socio¬economic status than investments at later educational stages [10].
ET 2020 recognises ECEC’s potential for addressing social inclusion and economic chal-lenges. It has set a benchmark to ensure that at least 95 % of children aged between four and the starting age of compulsory education participate in ECEC. As Figure 4.4 shows, participation in ECEC has risen more or less continuously in the EU since 2000. Several countries had already exceeded the ET 2020 benchmark in 2011, implying almost universal pre-school attendance.
Integrating migrants and ethnic minorities in early childhood education remains a challenge
Gender differences in early childhood education are negligible across the EU. However, children with a migrant background or from ethnic minorities are in a very disadvantaged position. For example, a recent study of 11 Member States revealed a large gap between Roma and non-Roma children attending pre-school and kindergarten in nine of the countries [11]. The EU has since identified accessibility to early childhood education and care for children from ethnic minorities as an important priority area within the ECEC participation framework. This reflects the growing consensus at policy level that early pre-schooling has an important role to play in addressing disadvantages and reducing the risk of poverty and social exclusion [12].
Acquiring the relevant skills for the knowledge society
A key objective of all educational systems is to equip people with a wide range of skills and competences. This encompasses not only basic skills such as reading and mathematics, but also more transversal ones such as information and communications technology (ICT) and entrepreneurship.
Basic skills: poor reading, maths and science affect one-fifth of EU pupils
Basic skills, whether reading simple text or performing easy calculations, provide the basis for learning, gaining specialised skills and personal development. The ET 2020 framework acknowledges the increasing importance of individual skills in the era of the knowledge-based economy. In response, it has set a target to reduce the share of 15 year olds achieving low levels of reading, mathematics and science to less than 15 % by 2020.
In 2009, about one fifth of 15 year old EU citizens showed insufficient abilities in reading, mathematics and science as measured by the OECD’s PISA study [13]. The test results were best for science, with 17.7 % low achievers, followed by reading with 19.6 % and maths with 22.2 %. Figure 4.5 shows how the overall performance in reading, mathematics and science varies significantly across countries. The share of pupils failing to acquire competences in the key subjects surpasses 38 % in Bulgaria and Romania. However, Northern Europe, in particular Finland, Estonia and the Netherlands, shows the lowest share of low achievers in reading, mathematics and science with levels below 15 %.
Compared with international competitors, the overall EU’s share of low-achievers in reading, maths and science was similar to the United States. However, it was higher than for Japan or Korea, where the shares of low-achieving pupils in 2009 were below 14 % and 9 % respectively.
Achievement in science has shown the most progress at the EU level since 2000, while progress in mathematical competences has been the slowest [14]. For the EU as a whole, the ET 2020 benchmark implies that the share of low achievers needs to be reduced by almost a third compared with 2009 levels.
For gender, a large gap exists in reading performance. In 2009, the share of low achieving EU pupils was about twice as high among boys (25.9 %) than among girls (13.3 %). This means girls have already reached the ET 2020 framework’s 15 % reading benchmark, implying effort needs to be focused on boys to equalise performance levels [15]. Gender differences are considerably smaller in the other key subject areas. Boys slightly outperform girls in maths and girls slightly outperform boys in science.
Foreign language learning most widespread in Eastern Europe
The ability of citizens to communicate in at least two languages besides their mother tongue has been identified as a key priority area in the EU’s ET 2020 framework. Work on a possible benchmark is currently under way. In all Member States except Ireland and parts of the United Kingdom (Scotland) at least one foreign language is studied as a mandatory subject in compulsory education. Most countries also provide for an optional second foreign language [16].
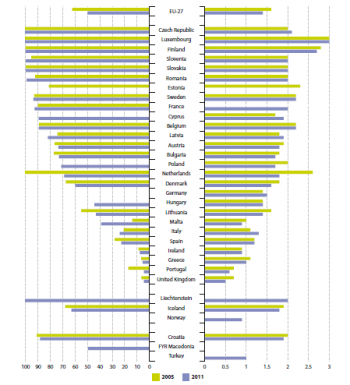
Figure 4.6 shows that in 2011 the study of a second foreign language in general upper secondary education (ISCED level 3 general) was almost universal in Luxembourg, Finland and most of the Eastern European countries. It was much less popular in English-speaking countries (United Kingdom and Ireland) and in Italy, Portugal, Greece and Spain.
In many Member States the proportion of students in general upper secondary education learning two or more foreign languages has stagnated or decreased compared with 2005 levels. The Netherlands experienced a particularly sharp decrease in the share of pupils learning two or more foreign languages from 100 % in 2005 to below 70 % in 2011.
In terms of the average number of foreign languages studied as part of compulsory education, Luxembourg takes first place (3 languages), followed by Finland (2.7), Belgium (2.2) and Sweden (2.2). Pupils enrolled in upper secondary education in France and most Eastern European countries study on average at least two foreign languages. In contrast, students in the United Kingdom, Ireland, Portugal and Malta have language proficiency in less than one foreign language on average. Only a few countries have expanded the number of foreign languages taught in mandatory curriculums over the past six years, in particular the Czech Republic, Cyprus, Latvia, Germany and Italy.
In 2010, 93.7 % of students at ISCED level 2 were learning English as a foreign language, making it the most widely studied foreign language across the EU. This represents a sub-stantial increase in its popularity, compared with 74.3 % a decade earlier. French, German and especially Spanish have also been steadily gaining popularity over that time [17].
ICT skills: enhancing digital competences
Enhancing digital competences to exploit the potential of information and communication technologies (ICT) is a key priority under the Europe 2020 strategy. Its flagship initiative ‘Digital Agenda for Europe’ aims to help achieve this goal. The lack of digital literacy and skills is seen as ‘excluding many citizens from the digital society and economy and is holding back the large multiplier effect of ICT take-up to productivity growth’ [18].
ICT skills are also relevant to the Europe 2020 strategy’s headline indicator on R&D expenditure. An analysis of European citizen’s computer and internet skills is provided in the dedicated chapter (see p. 63).
How tertiary education and life-long learning contribute to the EU’s human capital
The number of tertiary graduates is growing rapidly
Raising the share of 30 to 34 year olds having completed tertiary or equivalent education to at least 40 % is the second of the two Europe 2020 education targets. It is monitored with the headline indicator tertiary educational attainment of the same age group.
Figure 4.7 shows a steady and considerable growth in the share of 30 to 34 year olds who have successfully completed university or university-like (tertiary-level) education since 2000. The 13.4 percentage point growth over the period 2000 to 2012 equals an increase of about 50 % in tertiary graduates in the EU [19].
Women significantly outnumber men in tertiary educational attainment
Figure 4.8 shows a significantly growing gender gap among tertiary education graduates across the EU. While in 2000 the share of 30 to 34 year olds with tertiary educational attainment was similar for both sexes, the increase up to 2012 was almost twice as fast for women. In 2012 women outnumbered men significantly in terms of tertiary education in all Member States except Luxembourg [20]. In fact, 15 Member States showed a gender gap of more than 10 percentage points in 2012, and in Estonia, Latvia and Slovenia the differences were more than 20 percentage points.
Gender differences in tertiary education can also be seen in the choice of fields studied. A significantly higher proportion of men than women graduate in mathematics, science or engineering subjects. Women tend to dominate education, humanities, art and service-oriented educational fields (28).
Northern and Central Europe show the highest tertiary education levels

(% of population aged 30 to 34)
Source: Eurostat online data code (edat_lfse_12)
The trend in the EU as a whole mirrors increases in tertiary educational attainment levels across all EU Member States. This to some extent reflects Member States’ investment in higher education to meet demand for a more skilled labour force. Moreover, the increases in attainment rates can also be ascribed to the shift to shorter degree programmes following implementation of Bologna process reforms in some Member States [21].
National targets for tertiary education [22] range from 26 % for Italy to 60 % for Ireland. Austria and Germany’s targets are slightly different from the overall EU target because they include post-¬secondary attainment (ISCED level 4 for Germany, and ISCED level 4a for Austria). This is considered equivalent to university education in these two countries.
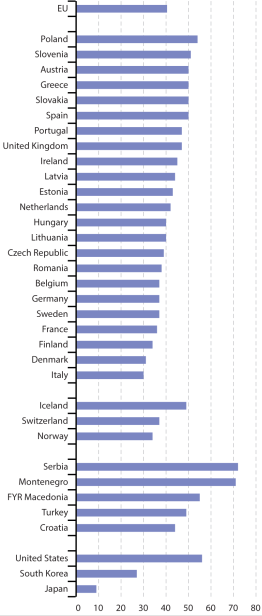
In 2012, ten countries had already achieved their national targets: Cyprus, Luxembourg, Lithuania, Sweden, Finland, Germany, Denmark, the ¬Netherlands, Austria and Latvia. Hun-gary, Slovenia and Estonia were close at less than one percentage point from their national targets. Slovakia, Portugal and Malta were the most distant, at some 10 percentage points below their targets.
Levels of tertiary educational attainment varied by a factor of about 2.5 across Europe in 2012. ¬Northern and Central Europe had the most graduates, with 12 countries exceeding the overall EU target of 40 %. The lowest levels could be observed in ¬Italy, Romania, Malta, Slovakia and Croatia, which were all below 25 %.
At the same time, some Eastern European countries experienced the strongest increases in tertiary educational attainment over the period 2005 to 2012. Changes were most pronounced in Latvia, Poland, Slovakia, Czech Republic and Hungary, with shares growing by two-thirds or more.
Looking at non-EU Europe, the EFTA countries Norway, Switzerland and Iceland were level with the best performing EU Member States in 2012. However, the candidate countries FYR Macedonia [23] and Turkey showed tertiary educational attainment levels similar to Southern and Eastern European Member States.
The regional differences in tertiary educational attainment across Europe shown in Map 4.3 are to a large extent in line with the general country differences (see Figure 4.9). In 2012 many regions in France, the United Kingdom, Finland and Sweden had above average tertiary educational attainment rates. On the other hand, most regions in Italy, Hungary and Romania showed a very small proportion of tertiary graduates.
Germany, Spain, Hungary and the United Kingdom showed the biggest within-country dispersion rates in tertiary educational attainment in 2012. In these countries, the best performing regions showed tertiary educational attainment levels of almost twice the rates of the worst performing regions (or even more than double in the case of Germany). In contrast, Belgium, Bulgaria and the Netherlands were the most ‘equal’ countries, with only slight within-country variations in tertiary educational attainment levels.
Map 4.4 shows the distance of regions to the respective national Europe 2020 targets. The cross-country regional performance in terms of tertiary education is very different when compared with the distance to the national target. Even though some regions in France, Spain, Lithuania and Ireland had a comparatively high proportion of citizens with a tertiary education, they still lag behind their national targets. This might be a result of the level of ambition reflected in the national tertiary education targets, which determines the difficulty of reaching these goals. For example, France and Ireland’s national targets exceed the EU average target by 10 and 20 percentage points, respectively.
Low levels of student mobility in higher education
Apart from providing valuable academic and cultural benefits, educational mobility is considered increasingly important for improving young people’s employability and access to the labour ¬market [24]. Increased mobility in higher education — those of students, researchers and staff — has been established as a key priority area within the framework of the Bologna Process [25]. In 2009 European ministers responsible for higher education met to take stock of the achievements of the Bologna Process. As a result they agreed on the benchmark that ‘in 2020 at least 20 % of those graduating in the European Higher Education Area should have had a study or training period abroad’ [26]. The benchmark refers to two main forms of mobility: degree mobility (undertaking a full degree programme in another country) and credit mobility (taking part of a study programme in a university abroad) [27].
Direct assessment of Member States’ progress towards the EU mobility benchmark cannot be made because the current data on students going abroad do not provide information on graduates’ degree and credit mobility. Nevertheless, statistics on student enrolment in higher education provide a useful indication of general mobility trends. In 2011 the average mobility rate for the EU was rather low, at 3.4 % and 3.3 % for incoming and outgoing students respectively. This average, however, obscures huge variations in study mobility trends across Member States. More than half of tertiary students from Cyprus, Luxembourg and Liechtenstein were enrolled in another European country in 2011 (see Figure 4.10). Limited provision of study places within their own educational system is the most likely reason for this. In contrast, 12 EU Member States showed rather low outbound mobility levels below 3 %, in particular the United Kingdom and Spain. Many Eastern European countries had a significant flow of outgoing students, but very few incoming ones.
Inbound mobility can generally be seen as a sign of the attractiveness of a country’s higher education as well as its financial and institutional capacity for enrolling foreign students [28]. Outward mobility, on the other hand, might be a result of policies encouraging students to spend part of their studies abroad (credit mobility in particular) [29].
Learning as a life-long process
Higher education institutions are not only crucial for providing Europe with a young and highly qualified labour force, they are also vital for life-long learning.
Adult education and training covers the longest time span in the process of learning throughout a person’s life. After an initial phase of education and training, continuous, life-long learning is crucial for improving and developing skills, adapting to technical developments, advancing one’s career or returning to the labour market [30] (also see the ‘greener, more inclusive - education Employment’ chapter,). In recognition of this, life-long learning plays a crucial role in the Europe 2020 flagship initiatives ‘Youth on the move’ and ‘An Agenda for new skills and jobs’ . In addition, the European Council in 2011 adopted a resolution on a renewed European agenda for adult learning [31]. The EU’s ET 2020 framework also includes a benchmark of raising the share of adults participating in life-long learning to at least 15 %.
After growing between 2003 and 2005, the share of EU adults participating in life-long learning fell slightly to about 9 % in 2012. As such, the EU has not made any progress towards the 15 % benchmark to be met by 2020.
This trend reflects the situation at the national level. Life-long learning has remained stable or even declined in more than half of the Member States. Only eight countries experienced a substantial increase of more than five percentage points over the period 2003 to 2012: Austria, the Czech Republic, Denmark, Estonia, Spain, Luxembourg, Portugal and Sweden. In 2012, only five EU countries from Northern Europe (Denmark, Sweden, Finland, the Netherlands and the United Kingdom) exceeded the ET 2020 benchmark. In 14 Member States participation in life-long learning was less than half of the required level of 15 %.
Women, migrants, highly educated people and employed people participate more in life-long learning
Women are more likely to participate in life-long learning than men. In 2012, the share of women engaged in life-long learning was 1.3 percentage points higher than for men (9.7 % as opposed to 8.4 %). Men, however, show a higher preference for non-formal job-related learning.
Migrants also tend to be slightly more involved in life-long learning activities (9.9 % in 2011). This may reflect participation in targeted learning activities such as language courses. It may also be linked to higher unemployment rates among migrants in some countries, resulting in a greater participation in labour market integration measures [32] (see ‘greener, more inclusive - employment Employment’ chapter).
There is a clear gradient of participation in life-long learning and a person’s educational attainment. In 2012 people with at most lower secondary education were much less engaged in life-long learning (3.9 %) than those with upper secondary (7.7 %) or tertiary education (16.1 %).
In relation to labour status, employed people in general show a slightly higher participation rate in life-long learning. Some 9.7 % of employed 25 to 64 year olds took part in life-long learning in 2012. For unemployed people, the participation rate was similar to the total participation rate in life-long learning, at 9 %.
Entrepreneurial skills are crucial for the transition towards a knowledge-based society
The EU’s framework for key competences identifies and defines the key abilities and knowledge a person needs to achieve employment, personal fulfilment, social inclusion and active citizenship in today’s rapidly changing world [33]. In this context, entrepreneurship competences are defined as an individual’s ability to turn ideas into action. This transversal set of skills refers to creativity, innovation and risk-taking as well as general management skills needed to achieve objectives [34].
Enhancement of entrepreneurial skills is endorsed as a key long-term priority in the ET 2020 framework. The Europe 2020 strategy also recognises it as being crucial to the transition to a knowledge-based society. The importance of enhancing creativity, innovation and entrepreneurship through education is highlighted in three flagship initiatives: ‘Youth on the move’, ‘An Agenda for new skills and jobs’ and ‘Innovation Union’.
The Global Entrepreneurship Monitor (GEM) provides a source of annual country data on the population’s perceived levels of entrepreneurship skills, based on adult population surveys. The GEM project is run by a consortium of universities with special teams of experts from almost 100 participating countries [35]. Figure 4.12 shows that in 2012 at least 50 % of the adult population in six EU Member States believed they have the skills and knowledge to start a business. Poland takes the lead with more than half of its working-age population expressing good self-perceived entrepreneurial capabilities. However, in most Nordic countries fewer adults display confidence in their competences. It should be noted that differences in attitudes might reflect not only levels of entrepreneurial education and training, but also factors such as individuals’ levels of confidence or voluntary training beyond formal education [36].
Education levels and labour market participation
Younger people show higher educational attainment levels
Educational attainment is the visible output of education systems. Achievement levels can have major implications for many issues touching a person’s life. This is reflected in participation in life-long learning as well as in other aspects presented in the chapters in this publication, in particular ‘Employment’ (see p. 27) and ‘Poverty and social exclusion’ (see p. 125).
Upper secondary education is now considered as the minimum desirable attainment level for all European citizens leaving the education and training system (which is reflected in the Europe 2020 headline indicator on early leavers from education and training, see p. 96). Figure 4.13 shows the share of the population that has completed upper secondary or tertiary education, broken down by sex and age groups.
In 2012, more than 80 % of the 20 to 34 year olds had completed at least upper secondary education, while the share for the age group 55 to 64 was much lower, at 65 %. This difference reflects the growing demand for a higher skilled workforce in most parts of Europe over the past decades. The process of older groups steadily leaving the workforce and being replaced by a younger, higher educated generation will lead to a more skilled workforce. If labour markets do not provide adequate jobs this may result in certain levels of over-qualification and youth unemployment (48). For older workers aged 55 to 64, lower educational attainment levels, especially among women, highlight the importance of life-long learning to increase their employability and help meet the Europe 2020 strategy’s employment target (see the ‘Employment’ chapter, p. 27).
Educational attainment is highest in Eastern Europe, where upper secondary education has long been the standard [37]. Southern European countries in contrast show the lowest education levels. In 2012, less than half of the population aged 25 years or over living in Spain, Italy, Malta and Portugal had completed more than lower secondary education. However, these countries have shown the strongest improvements over time, with education levels among 20 to 24 year olds being about twice as high as among those close to retirement.
Figure 4.13 also shows how women have overtaken men in educational attainment. While in the age group 45 to 64 years attainment is higher for men, the situation is turned around in the population aged 44 and younger. This trend illustrates the gender differences observed for a number of the indicators analysed in this chapter, such as early leavers from education and training, tertiary education, or participation in life-long learning.
Consequences of low educational attainment
Low educational attainment — at most lower secondary education — is usually negatively linked with other socioeconomic variables. The most important of these are employment, unemployment and the risk of poverty or social exclusion. Some of these relationships are also analysed in detail in their respective chapters (see the chapters ‘Employment’ on p. 27 and ‘Poverty and social exclusion’ on p. 125).
Early leavers from education and training and low-educated young people face particularly severe problems in the labour market. As shown in Figure 4.14, about 58 % of 18 to 24 year olds with at most lower secondary education and who were not in further education or training were either unemployed or inactive in 2012. Of these, 70 % stated they would like to work. At the same time, the EU’s overall youth unemployment rate (covering the age group 15 to 24 years) stood at 22.8 %. This implies that unemployment levels among early leavers from education and training are much higher than among the total population of the same age group [38]. This is illustrated by Figure 4.15.
Compared with the overall decline in early leaving from education and training (see Figure 4.2), Figure 4.14 reveals it is becoming more difficult for early school leavers to find employment. Between 2005 and 2012, the share of 18 to 24 year old early leavers who were not employed but wanted to work grew from less than one third to more than 40 %.
The analyses in the ‘Employment’ chapter (see p. 27) show that unemployment rates are higher for young people aged 15 to 24 years as well as for those with lower educational attainment. Figure 4.15 shows the breakdown of youth unemployment rates in relation to educational attainment. Young people with at most lower secondary education are clearly the most disadvantaged group, with an unemployment rate of over 30 % in 2012. Unemployment rates for the other two groups were more than 10 percentage points lower.
Low-educated 15 to 24 year olds have at the same time experienced the biggest growth in unemployment since 2000, when their unemployment rate was about 10 percentage points lower. It is interesting to note that this worsening compared with the other two subgroups has not only been caused by the recent economic crisis. Indeed, the situation of low-educated 15 to 24 year olds had already been deteriorating slightly in the period before 2007. Unemployment had fallen in particular for those with upper secondary education.
Young people neither in employment nor in education or training face a high risk of being excluded from the labour market
The rate of young people neither in employment nor in education or training (NEET) provides information on young people aged 18 to 24 years who are not in employment and not in any further education and training. Low educational attainment, together with having some kind of disability or coming from a migration background, is one of the key determinants of young people entering the NEET category [39].
In 2012, 17.0 % of 18 to 24 year olds were in the NEET status and thus at risk of being excluded from the labour market and depending on benefits. This represents a considerable increase since 2008, when the NEET rate stood at a low of 13.9 %.
As shown in Figure 4.16, the EU’s NEET rate has been mainly influenced by changes in youth unemployment, whereas youth inactivity has remained more or less stable, at or slightly below 8 %. NEET rates are slightly higher for women than for men, although the gender gap has closed slightly since the onset of the economic crisis in 2008. In 2012, the NEET rate for 18 to 24 year old women was 17.5 %, with more than half (55.4 %) being economically inactive. At the same time, the NEET rate for men of the same age group was 16.6 %, but almost two-thirds were unemployed.
Low educational attainment negatively influences quality of life
The negative impacts of low educational attainment described here and in the chapters ‘Employment’ (see p. 27) and ‘Poverty and social exclusion’ (see p. 125) also influence other aspects of a person’s perceived quality of life [40]. Across the EU, the perception of being in good or very good health in 2011 was highest among people having completed tertiary education (81.5 %). Only slightly more than half (55 %) of the people with at most lower secondary educational attainment shared this perception. Similarly, the perception of not being limited in one’s daily activities is generally higher among people with tertiary education (84.3 %). This compares with more than one-third of low-educated people perceiving at least some limitations.
Matching skills with labour market needs
The EU’s ET 2020 framework acknowledges the important role of education and training in raising employability. It has set a benchmark that at least 82 % of graduates (20 to 34 year olds) should have found employment no more than three years after leaving education and training [41].
Figure 4.17 shows that recent graduates have been affected particularly strongly by the economic crisis. Between 2008 and 2012, employment rates among 20 to 34 year olds who had left education and training in the past three years fell by 6.3 percentage points. In comparison, the decline in the overall employment rate for 20 to 64 year olds was ‘only’ 1.8 percentage points over the same period.
The data in Figure 4.17 refer to graduates having left education and training with at least upper-secondary qualifications (ISCED levels 3 to 6). A disaggregation by educational attainment reveals that the fall in the employment rate has been stronger for the lower educated cohort (– 7.8 percentage points since 2008) than for those with tertiary education (– 5.4 percentage points since 2008). This is in line with the trends observed in the ‘greener, more inclusive - employment Employment’ chapter on the overall employment rate, and underlines the importance of educational attainment for employability.
Matching educational outcomes and labour market needs is a key component of the Europe 2020 strategy (see the ‘greener, more inclusive - employment Employment’ chapter). ‘Equipping people with the right skills for employment’ has been identified as one of four priorities of the flagship initiative ‘An Agenda for new skills and jobs’. In particular the impact of the economic crisis and the persistent high level of unemployment have increased the need to better understand where future skills shortages are likely to lie in the EU [42].
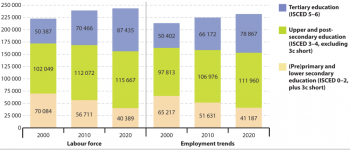
Most recent forecasts from the European Centre for the Development of Vocational Training (Cedefop) [43] indicate that between 2010 and 2020 some 18 million jobs requiring medium or high educational attainment will be created, while at the same time low-qualified jobs will decline by about 10 million.
Figure 4.18 contrasts these estimates with projected changes in the EU labour force. As already indicated in Figure 4.13 and the accompanying analysis, the population holding a university degree or equivalent is expected to grow by almost 25 % between 2010 and 2020. In comparison, the number of low-skilled people will fall by almost one-third.
Overall, the Cedefop forecasts show a parallel rise in skills from both the demand and the supply side until 2020. Changes in skills levels are expected to occur faster for the labour force than in employment trends. This parallel rise does not prevent potential skills mismatches, such as over-¬qualification gaps [44].
Investment in future generations: the case of public expenditure on education
Public expenditure on education as a percentage of GDP is often considered an indicator of the level of a government’s commitment to developing skills and competences.
Two developments have had major impacts on the role of education and training systems: the recent economic crisis and the ageing of the population. The financial and economic crisis has had major impacts on our labour markets, economies and societies in general. The ageing of the population across most Member States also bears important implications on educational systems through its effects on the labour market and public finances [45].
Investment in education is essential for facing both of these challenges through means of fostering economic growth and productivity, and enhancing innovation and competitiveness. While fiscal and monetary policies can counteract the adverse effects of the crisis in the short-run, educational investments are necessary policy measures for addressing the long-term impacts on unemployment. Human capital accumulation cannot only reduce the pressure on labour markets at a time of economic crisis but also compensate for the projected shrinking labour force in European economies [46].
As shown in Figure 4.19, public expenditure on education as a % of GDP remained relatively stable at about 5 % in the period between 2001 and 2008, but grew to about 5.4 % in 2009, where it remained in 2010. This average figure conceals considerable cross-country variations in the allocation of public resources for education, ranging from 3.5 % in Romania to 8.8 % in Denmark. In terms of allocating resources to different educational levels, investment in secondary education has remained almost double the amount invested in primary and tertiary qualifications.
Investment in education at EU level has been stable despite the economic crisis. Education systems across the EU have been affected differently by the recession, partly reflecting the extent to which the crisis has hit national economies. Although one-third of Member States have sustained their expenditure on education from 2007 onwards, a number of countries such as Italy, Hungary, Bulgaria, Greece, Latvia, Romania and Iceland have reduced their education budgets over several consecutive years [47].
A recent report by Eurydice (the European network for education systems and policies) shows that in 2011 six countries experienced a reduction in education budgets compared with the previous year. However, in most cases the reasons for these budget cuts have been confined to demographic trends rather than anti-crisis measures [48].
Students from disadvantaged groups most affected by cutbacks on education
Economic downturns and cutbacks on education are likely to generate particularly severe impacts on students from disadvantaged backgrounds [49]. This is because disadvantaged children often tend to be concentrated in schools with fewer resources. Furthermore, households from higher socioeconomic backgrounds might have the financial resources to compensate for the reduction in support at school through private tuition, for example. Disadvantaged students have much fewer options for overcoming these obstacles.
Apart from general funding mechanisms for allocating resources across different educational levels, governments can also provide additional educational support to disadvantaged students through the award of specific programme funds. These funds can be distributed according to predefined need-based criteria, targeting for example specific geographic, social, language or other groups [50]. The targeted support could cover a variety of programmes ranging from the provision of language classes for minority groups and improvement in student–teacher ratio to the implementation of general schemes reducing student drop-out rates. In some Member States (the Czech Republic and Ireland) crisis-led adjustments included a reduction in the number of support teachers in schools, or supplementary programmes supporting low-performing or migrant students. In contrast, against the background of austerity measures, Belgium (French and Flemish Communities) and Spain have reported an increase in their budgets for specific support programmes. The United Kingdom (England and Wales) has taken similar measures by making available new support funds for students from disadvantaged back-grounds [51].
Conclusions and outlook towards 2020
Early leaving from education and training has fallen continuously in the EU since 2000, for both men and women. The fall from 17.6 % in 2000 to 12.8 % in 2012 represents steady progress towards the Europe 2020 target. Young men, migrants and ethnic minorities are more likely to leave education and training with at most lower secondary education. While in 2012 women were already close to the overall EU target, at 11.0 % early school leavers, the rate was much higher for men, at 14.5 %.
Improvements have also been visible in the second Europe 2020 headline indicator. Between 2000 and 2012, the share of 30 to 34 year olds having completed tertiary educational attainment grew continuously from 22.4 % to 35.8 %. Growth was considerably faster for women, who in 2012 had already met the Europe 2020 target. In contrast, only 31.6 % of 30 to 34 year old men had completed tertiary education in the same year.
Educational attainment strongly determines successful participation in the labour market. In 2012, 58 % of 18 to 24 year old early leavers from education and training were either unemployed or inactive. Of the total population of 18 to 24 year olds, 17.0 % were neither in employment nor in any further education or training (NEET) and thus at risk of being excluded from the labour market. This is also reflected in the youth unemployment rate, which was particularly high for low-educated 15 to 24 year olds, at 30.3 %. This is more than 10 percentage points above the unemployment rates of young people with upper secondary or tertiary education.
Progress in the other education indicators for which benchmarks have been set in the EU’s ET 2020 framework is mixed. Participation in early childhood education and care (ECEC) has grown more or less continuously in the EU since 2000. In 2011, 93.2 % of children between the age of four and the starting age of compulsory education participated in ECEC, compared with 85.1 % in 2000. This is a considerable move towards the ET 2020 benchmark of at least 95 %.
The picture is less optimistic when it comes to basic skills such as reading, maths and science. In 2009 about one-fifth of 15 year olds showed insufficient abilities in reading, maths and science. This means that a reduction of almost a third will be necessary to reach the ET 2020 benchmark. In 2011, the average EU mobility rate taking into account only degree mobility was around 3 %, masking however huge differences across Europe and between incoming and outgoing students.
In relation to adult education, which is important because it covers the longest time span in the process of life-long learning, the share of adults participating in life-long learning has fallen slightly since 2005, to 9 % in 2012. As such, the EU has not made any progress towards the ET 2020 benchmark of raising the share of adults engaging in life-long learning activities to at least 15 % by 2020.
Finally, in relation to the important role of education and training on employability, the employment rate of recent graduates (20 to 34 year olds having left education and training in the past three years) has experienced a considerable drop since the economic and financial crisis began. It has fallen from 82 % in 2008 to less than 76 % in 2012. This trend, which shows that the targeted age group has been affected particularly strongly by the crisis, has moved the EU away from the ET 2020 benchmark of raising the employment rate of recent graduates to at least 82 % by 2020.
Forecasts concerning the skills required by the labour market until 2020 underline the importance of higher education. Between 2010 and 2020 some 18 million jobs requiring medium or high qualification are expected to be created, whereas at the same time low-qualified jobs will decline by about 10 million.
Efforts needed to meet the Europe 2020 targets on education
Knowledge about current student cohorts and the existing demographic projections allow estimations of educational trends up to 2020, which can help identify priority issues that may need particular political attention on the path towards meeting the Europe 2020 targets. For example, students who are now in their mid-20s will in 2020 fall within the scope of the Europe 2020 headline indicator on ‘tertiary educational attainment’, which looks at education levels of the population aged 30 to 34 years.
The flagship initiatives ‘Youth on the move’ and ‘An Agenda for new skills and jobs’ address the challenge of early leaving from education and training. In 2011, the European Council published recommendations on policies to reduce early leaving from education and training [52], giving guidance to Member States on the implementation of strategies and measures tackling this problem. Vocational Education and Training (VET) systems are seen as an important contribution to the employability of young people and the reduction of early leaving from education and training, by offering an interesting alternative to general education [53].
Additionally, the Europe 2020 strategy puts particular efforts on making sure that higher education courses develop skills profiles relevant to the world of work, both for meeting future labour demand and for ensuring the long-term attractiveness of higher education [54]. Moreover, the European Council’s Resolution on a renewed European agenda for adult learning [55] addresses the challenge of raising participation rates of adults in life-long learning activities.
Data sources and availability
ET 2020 — the EU’s Strategic Framework for Education and Training 2020
The two Europe 2020 targets are embedded in the broaderStrategic Framework for Education and Training 2020 (ET 2020) [56]. ET 2020 aims to foster European cooperation in education and training, providing common strategic objectives for the EU and its Member States for the period up to 2020. ET 2020 covers the areas of life-long learning and mobility; quality and efficiency of education and training; equity, social cohesion and active citizenship; creativity, innovation and entrepreneurship at all levels of education and training. To support the achievement of these objectives ET 2020 sets EU-wide benchmarks. Apart from the two Europe 2020 targets on education, there are six additional benchmarks:
At least 95 % of children between four years old and the age for starting compulsory primary education should participate in early childhood education.
The share of low-achieving 15 year olds in reading, mathematics and science should be less than 15 %.
An EU average of at least 20 % of higher education graduates should have had a period of higher education-related study or training (including work placements) abroad, representing a minimum of 15 ECTS ¬credits [57] or lasting a minimum of three months.
An EU average of at least 6 % of 18 to 34 year olds with an initial vocational education and train-ing (VET) qualification should have had an initial VET-related study or training period (including work placements) abroad lasting a minimum of two weeks, or less if documented by Eu-ropass [58].
An average of at least 15 % of adults should participate in life-long learning.
The share of employed graduates (20 to 34 year olds) having left education and training no more than three years before the reference year should be at least 82 %.
EU initiatives promoting mobility in higher education
The EU has set up a number of initiatives to promote mobility in higher education under the Lifelong Learning Programme [59], including Erasmus for study exchanges and placements [60], Erasmus Mundus for postgraduate studies[61], Leonardo Da Vinci for vocational education and training [62], Marie Curie for research fellowships [63] and Grundtvig for adult education [64]. As part of the Europe 2020 strategy, the flagship initiative ‘Youth on the move’ ([65] also aims to extend opportunities for learning mobility to all young people in Europe, mainly through financial support and dissemination of information.
Policies tackling youth unemployment
The Europe 2020 flagship initiative ‘Youth on the move’ emphasises that ‘youth unemployment is unacceptably high’ in the EU, and that ‘to reach the 75 % employment target for the population aged 20 to 64 years, the transition of young people to the labour market needs to be radically improved’. To this end, the flagship initiative focuses on four main lines of action [66]:
- Support actions for life-long learning, to develop key competences and quality learning outcomes, in line with labour market needs; this also means tackling the high level of early school leaving.
- Raise the percentage of young people participating in higher education or equivalent to keep up with competitors in the knowledge-based economy and to foster innovation.
- Improve learning mobility programmes and initiatives, to support the aspiration that by 2020 all young people in Europe should have the possibility to spend a part of their educational pathway abroad, including via workplace-based training.
- Urgently improve the employment situation of young people, by presenting a framework of policy priorities for action at national and EU level to reduce youth unemployment by facilitating the transition from school to work and reducing labour market segmentation.
Youth employment is also addressed by the EU employment package ‘Towards a job-rich recovery’, which reaffirms the European Commission’s commitment to tackle the dramatic levels of youth unemployment, ‘by mobilising available EU funding’ and by supporting the transition to work ‘through youth guarantees, activation measures targeting young people, the quality of traineeships, and youth mobility’ [67].
Policies tackling the transition from education to employment
The EU employment package ‘[68]’, under its objective of restoring the dynamics of labour markets, calls for ‘security in employment transitions’, such as the transition of young people from education to work: ‘there is evidence to show that apprenticeships and quality traineeships can be a good means of gaining entry into the world of work, but there are also recur-ring examples of traineeships being misused’. The employment package also reaffirms the Euro-pean Commission’s commitment to tackle the dramatic levels of youth unemployment by supporting the transition to work ‘through youth guarantees, activation measures targeting young people, the quality of traineeships, and youth mobility’ [69].
Projections up to 2020 in relation to the Europe 2020 education targets
Despite the decline of early leavers from education and training, projections up to 2020 from the EU’s Joint Research Centre (JRC) suggest that the EU could fall short of its target of reducing early school leaving to less than 10 %. According to these calculations (based on data up to 2011), an additional 1.5 million individuals will have to remain in the education and training systems in order to reach the headline target by 2020, amounting to an average of about 170 000 individuals per year.
Taking into account the latest projections of demographic changes, even bigger effort is needed. As compared to 2011, an additional two million individuals will have to be kept in education and training, translating into an annual average of about 220 000 individuals. This is an extra 20 000 fewer early school leavers per year on top of the annual change that was achieved between 2000 and 2011 [70]. This is also because the size of younger cohorts will shrink by 2020 in most Member States and across the EU, changing the relative weight of each country as measured by its population share in the total EU population [71].
In contrast, the JRC projections suggest that the tertiary education target is within reach ‘as, by 2020, the EU will only need less than half of the progress observed in the previous decade. There-fore, if the dynamic registered in the past is to continue and assuming no severe adverse shocks, Europe should easily outperform the target’ [72].
Notably, based on current trends, women could be expected to reach tertiary educational attainment levels above 50 %, meaning that by 2020 more than half of 30 to 34 year old women would have achieved tertiary qualification. Due to a much slower growth, men, on the other hand, would remain below the 40 % target, reaching ‘only’ tertiary educational levels of around 38 %. The different choices in study fields (men graduating more in mathe¬matics, science or engineering subjects, while women dominating in education, humanities, art and service-oriented educational fields), could cause some concern in relation to labour market opportunities for men and women [73].
Context
Education and training - why do they matter?
Education and training lie at the heart of the Europe 2020 strategy and are seen as key drivers for growth and jobs. The recent economic crisis along with an ageing population, through their impact on economies, labour markets and society, are two important challenges that are changing the context in which education systems operate [74]. At the same time education and training help boost productivity, innovation and competitiveness [75].
Nowadays upper secondary education is considered the minimum desirable educational attainment level for EU citizens. Young people who leave education and training prematurely lack crucial skills and run the risk of facing serious, persistent problems on the labour market and experiencing poverty and social exclusion. Early leavers from education and training who do enter the labour market are more likely to be in precarious and low-paid jobs and to draw on welfare and other social programmes. They are also less likely to be ‘active citizens’ or engage in life-long learning [76].
In addition, tertiary education, with its links to research and innovation, provides highly skilled human capital (see the chapter ‘greener, more inclusive - research and development Research and development’ chapter). A lack of these skills presents a severe obstacle to economic growth and employment in an era of rapid technological progress, intense global competition and labour market demand for ever-increasing levels of skill. The Europe 2020 strategy, through its ‘smart growth’ priority, therefore aims to tackle early school leaving and to raise tertiary education levels [77].
The analysis in this chapter builds on the headline indicators chosen to monitor the strategy’s education targets: ‘Early leavers from education and training’ and ‘Tertiary educational attainment’.
Contextual indicators are used to provide a broader picture and insight into drivers behind changes in the headline indicators. Some are also used to monitor progress towards additional benchmarks set under the EU’s Strategic Framework for Education and Training 2020 (ET 2020). These indicators include early childhood education, basic reading, maths and science skills and adult participation in life-long learning. The benchmarks are listed in Box 4.1.
The presentation of the headline and contextual indicators follows the typical educational pathway. It starts with early childhood education, followed by acquisition of basic skills (reading, maths and science) and foreign languages, leading to tertiary education and life-long learning in adulthood. The analysis then switches to the ‘outcome’ side. Here it looks at educational attainment in the EU labour force and the impacts of low levels of attainment. Last, the input into the education system, in the form of public expenditure on education, is investigated.
The EU’s education targets are interlinked with the other Europe 2020 goals: higher educa-tional levels help employability and progress in increasing the employment rate in turn helps to reduce poverty [78]. The tertiary education target is furthermore interrelated with the research and development (R&D) and innovation target. Investments in the R&D sector will raise demand for highly skilled workers (see the ‘Research and development’ chapter on p. 49).
Europe 2020 strategy target on education
The Europe 2020 strategy has targets on ‘improving education levels, in particular by aiming to reduce school drop-out rates to less than 10 % and by increasing the share of 30–34 year olds having completed tertiary or equivalent education to at least 40 %’ [79].
Further Eurostat information
Data visualisation
- Regional Statistics Illustrated - select statistical domain 'xxx' (= Agriculture, Economy, Education, Health, Information society, Labour market, Population, Science and technology, Tourism or Transport) (top right)
Publications
Main tables
Dedicated section
Methodology / Metadata
- Towards robust quality management for European Statistics - Communication from the Commission to the European Parliament and the Council COM(2011) 211 final
Other information
- Regulation 223/2009 of 11 March 2009 on European statistics
External links
See also
Notes
- ↑ European Commission, Europe 2020 — A strategy for smart, sustainable and inclusive growth, COM(2010) 2020 final, Brussels, 2010 (p. 11).
- ↑ The former Yugoslav Republic of Macedonia, see p. 209.
- ↑ European Commission, Early School Leaving (accessed 23 July 2013).
- ↑ European Commission (Directorate-General of Education and Culture), Education and Training Monitor 2012, Luxembourg: Publications Office of the European Union, 2012 (p. 18); International Organization for Migration, Foreign-born Children in Europe: An Overview from the Health Behaviour in School-Aged Children (HBSC) Study, 2009 (p.36).
- ↑ Dale et al., Early School leaving: Lessons from Research for Policy Makers, European Commission, 2010 (p. 30).
- ↑ European Union Agency for Fundamental Rights & UNDP, The Situation on Roma in 11 EU Member States, 2012 (p. 14).
- ↑ Speech of Morten Kjaerum, Director of the European Union Agency for Fundamental Rights, Exclusion and Discrimination in Education: the Case of Roma in the European Union, 8 April 2013.
- ↑ European Commission, An EU Framework for National Roma Integration Strategies up to 2020, COM(2011) 173 final, Brussels, 2011.
- ↑ See http://ec.europa.eu/europe2020/europe-2020-in-a-nutshell/targets/index_en.htm.
- ↑ European Commission, Early Childhood Education and Care: Providing All our Children with the Best Start for the World of Tomorrow, COM(2011) 66 final, Brussels, 2011 (p. 1 and p. 5).
- ↑ European Union Agency for Fundamental Rights & UNDP, The Situation on Roma in 11 EU Member States, Luxembourg: Publications Office of the European Union, 2012 (p. 13).
- ↑ European Commission, Early Childhood Education and Care: Providing All our Children with the Best Start for the World of Tomorrow, COM(2011) 66 final, Brussels, 2011 (p. 4).
- ↑ PISA is an international study that was launched by the OECD in 1997. It aims to evaluate education systems worldwide every three years by assessing 15-year-olds’ competencies in the key subjects: reading, mathematics and science. For further details see http://www.oecd.org/pisa/.
- ↑ European Commission (Directorate-General of Education and Culture), Education and Training Monitor 2012, Luxembourg: Publications Office of the European Union, 2012 (p. 33).
- ↑ European Commission (Directorate-General of Education and Culture), Education and Training Monitor 2012, Luxembourg: Publications Office of the European Union, 2012 (p. 33).
- ↑ European Commission (Directorate-General of Education and Culture), Education and Training Monitor 2012, Luxembourg: Publications Office of the European Union, 2012 (p. 34).
- ↑ European Commission (Directorate-General of Education and Culture), Education and Training Monitor 2012, Luxembourg: Publications Office of the European Union, 2012 (p. 36).
- ↑ European Commission, A Digital Agenda for Europe, COM(2010) 245 final, Brussels, 2010 (p. 6).
- ↑ European Commission (Directorate-General of Education and Culture), Education and Training Monitor 2012, Luxembourg: Publications Office of the European Union, 2012 (p. 23).
- ↑ The Luxembourgish tertiary attainment rate reflects to a large degree the highly educated population which is living and working in the country. Luxembourg has attracted a highly educated workforce which has immigrated from abroad and it therefore does not necessarily reflect the outcome of the Luxembourgish education system; see European Commission (Directorate-General of Education and Culture), Education and Training Monitor 2012, Luxembourg: Publications Office of the European Union, 2012 (p. 24).
- ↑ European Commission (Directorate-General of Education and Culture), Education and Training Monitor 2012, Luxembourg: Publications Office of the European Union, 2012 (p. 23).
- ↑ European Commission (Directorate-General of Education and Culture), Education and Training Monitor 2012, Luxembourg: Publications Office of the European Union, 2012 (p. 24).
- ↑ The former Yugoslav Republic of Macedonia, see p. 209.
- ↑ Eurydice (Education, Audiovisual and Culture Executive Agency), The European Higher Education Area in 2012: Bologna Process Implementation Report, 2012 (p. 153).
- ↑ The Bologna Process is an intergovernmental initiative involving the European Commission, the European Council and UNESCO-CEPES as well as representatives of higher education institutions, students, staff, employers and quality assurance agencies. It was aimed at creating a European Higher Education Area by 2010, and to promote the European system of higher education worldwide. For further details see http://ec.europa.eu/education/higher-education/bologna_en.htm.
- ↑ Communiqué of the Conference of European Ministers Responsible for Higher Education, The Bologna Process 2020 — The European Higher Education Area in the new decade, Leuven and Louvain-la-Neuve, 28–29 April 2009.
- ↑ Eurydice (Education, Audiovisual and Culture Executive Agency), The European Higher Education Area in 2012: Bologna Process Implementation Report, 2012 (p. 153).
- ↑ Eurostat, Key indicators on the social dimension and mobility: The Bologna Process in Higher Education in Europe, 2009 edition, Luxembourg: Office for Official Publications of the European Communities, 2009 (p. 98).
- ↑ Eurydice (Education, Audiovisual and Culture Executive Agency), The European Higher Education Area in 2012: Bologna Process Implementation Report, 2012 (p. 153).
- ↑ European Commission (Directorate-General of Education and Culture), Education and Training Monitor 2012, Luxembourg: Publications Office of the European Union, 2012 (p. 48).
- ↑ Council Resolution on a renewed European agenda for adult learning (2011/C 372/01), Official Journal of the European Union, 20.12.2011.
- ↑ European Commission (Directorate-General of Education and Culture), Education and Training Monitor 2012, Luxembourg: Publications Office of the European Union, 2012 (p. 49).
- ↑ See http://ec.europa.eu/education/lifelong-learning-policy/key_en.htm.
- ↑ European Commission (Directorate-General of Education and Culture), Education and Training Monitor 2012, Luxembourg: Publications Office of the European Union, 2012 (p. 39).
- ↑ For further details see http://www.gemconsortium.org.
- ↑ Alicia Coduras Martínez et al., Global Entrepreneurship Monitor Special Report: A Global Perspective on Entrepreneurship Education and Training, Global Entrepreneurship Research Association, 2010 (p. 30).
- ↑ European Commission (Directorate-General of Education and Culture), Education and Training Monitor 2012, Luxembourg: Publications Office of the European Union, 2012 (p. 54).
- ↑ European Commission, Early School Leaving (accessed 23 July 2013).
- ↑ European Commission (Directorate-General for Employment, Social Affairs and Inclusion), Employment and Social Developments in Europe 2011, Luxembourg: Publications Office of the European Union, 2012 (p. 28).
- ↑ Breakdowns of several ‘Quality of Life’ (QoL) indicators are available in a dedicated section on Quality of Life indicators on the Eurostat website: http://epp.eurostat.ec.europa.eu/portal/page/portal/quality_life/introduction.
- ↑ Council conclusions of 11 May 2012 on the employability of graduates from education and training (2012/C 169/04), Official Journal of the European Union, 15.6.2012.
- ↑ European Commission, An Agenda for new skills and jobs: A European contribution towards full employment, COM(2010) 682 final, Strasbourg, 2010 (p. 8).
- ↑ The Cedefop skills forecasts are available at http://www.cedefop.europa.eu/EN/about-cedefop/projects/forecasting-skill-demand-and-supply/skills-forecasts.aspx.
- ↑ European Commission (Directorate-General of Education and Culture), Education and Training Monitor 2012, Luxembourg: Publications Office of the European Union, 2012 (p. 57).
- ↑ European Commission (Directorate-General of Education and Culture), Education and Training Monitor 2012, Luxembourg: Publications Office of the European Union, 2012 (p. 7).
- ↑ Bilal Barakat, Johannes Holler, Klaus Prettner, and Julia Schuster, The Impact of the Economic Crisis on Labour and Education in Europe, Vienna Institute of Demography, 2010 (p. 12).
- ↑ European Commission (Directorate-General of Education and Culture), Education and Training Monitor 2012, Luxembourg: Publications Office of the European Union, 2012 (p. 11).
- ↑ European Commission (Directorate-General of Education and Culture), Education and Training Monitor 2012, Luxembourg: Publications Office of the European Union, 2012 (p. 12).
- ↑ OECD, Equity and Quality in Education: Supporting Disadvantaged Students and Schools, 2012 (p. 31).
- ↑ European Commission, Funding of Education in Europe 2000–2012: fckLRThe Impact of the Economic Crisis, 2013 (p. 68).
- ↑ European Commission, Funding of Education in Europe 2000–2012: fckLRThe Impact of the Economic Crisis, 2013 (p. 69).
- ↑ Council recommendations of 28 June 2011 on policies to reduce early school leaving (2011/C 191/01), Official Journal of the European Union, 1.7.2011.
- ↑ European Commission, Youth on the Move: An initiative to unleash the potential of young people to achieve smart, sustainable and inclusive growth in the European Union, COM(2010) 477 final, Brussels, 2010 (p. 6); European Commission, Early School Leaving (accessed 23 July 2013).
- ↑ European Commission, Tertiary Education (accessed 23 July 2013).
- ↑ Council Resolution on a renewed European agenda for adult learning (2011/C 372/01), Official Journal of the European Union, 20.12.2011.
- ↑ Council conclusions of 12 May 2009 on a strategic framework for European cooperation in education and training (‘ET 2020’) (2009/C 119/02), Official Journal of the European Union, 28.5.2009.
- ↑ ECTS is the European Credit Transfer and Accumulation System. The system allows for the transfer of learning experiences between different institutions, greater student mobility and more flexible routes to gain degrees. It also aids curriculum design and quality assurance. For further details, see http://ec.europa.eu/education/lifelong-learning-policy/ects_en.htm.
- ↑ Europass is a common European standard for making skills and qualifications clearly and easily understood across Europe. It includes five documents, two of which are completed by European citizens themselves (Curriculum Vitae and Language Passport) and three of which are issued by education and training authorities (Europass Mobility, Certificate Supplement, Diploma Supplement). For further details see http://europass.cedefop.europa.eu/en/about.
- ↑ See http://ec.europa.eu/education/lifelong-learning-programme/index_en.htm.
- ↑ See http://ec.europa.eu/education/erasmus/students_en.htm.
- ↑ See http://ec.europa.eu/education/lifelong-learning-programme/erasmus_en.htm.
- ↑ See http://ec.europa.eu/education/lifelong-learning-programme/ldv_en.htm.
- ↑ See http://ec.europa.eu/research/mariecurieactions/about-mca/actions.
- ↑ See http://ec.europa.eu/education/grundtvig/what_en.htm.
- ↑ European Commission, Youth on the Move: An initiative to unleash the potential of young people to achieve smart, sustainable and inclusive growth in the European Union, COM(2010) 477 final, Brussels, 2010.
- ↑ European Commission, Youth on the Move: An initiative to unleash the potential of young people to achieve smart, sustainable and inclusive growth in the European Union, COM(2010) 477 final, Brussels, 2010 (p. 3).
- ↑ European Commission, Towards a job-rich recovery, COM(2012) 173 final, Strasbourg, 2012 (p. 10).
- ↑ http://eur-lex.europa.eu/LexUriServ/LexUriServ.do?uri=CELEX:52012DC0173:EN:NOT
- ↑ European Commission, Towards a job-rich recovery, COM(2012) 173 final, Strasbourg, 2012 (p. 10).
- ↑ European Commission (Directorate-General of Education and Culture), Education and Training Monitor 2012, Luxembourg: Publications Office of the European Union, 2012 (p. 21).
- ↑ European Commission (Directorate-General of Education and Culture), Education and Training Monitor 2012, Luxembourg: Publications Office of the European Union, 2012 (p. 21).
- ↑ European Commission (Directorate-General of Education and Culture), Education and Training Monitor 2012, Luxembourg: Publications Office of the European Union, 2012 (p. 26).
- ↑ European Commission (Directorate-General of Education and Culture), Education and Training Monitor 2012, Luxembourg: Publications Office of the European Union, 2012 (p. 27).
- ↑ For further details on the impact of demographic ageing on the labour force see the chapter on ‘Employment’ on p. 27.
- ↑ European Commission (Directorate-General of Education and Culture), Education and Training Monitor 2012, Luxembourg: Publications Office of the European Union, 2012 (p. 10).
- ↑ European Commission, Early School Leaving (accessed 23 July 2013); European Commission (Directorate-General of Education and Culture), Education and Training Monitor 2012, Luxembourg: Publications Office of the European Union, 2012 (p. 17).
- ↑ European Commission, Early School Leaving and European Commission, Tertiary Education (accessed 23 July 2013).
- ↑ European Commission, Europe 2020 — A strategy for smart, sustainable and inclusive growth, COM(2010) 2020 final, Brussels, 2010 (p. 11).
- ↑ European Council conclusions 17 June 2010, EUCO 13/10, Brussels, 2010.
[[Category:<Subtheme category name(s)>|Europe 2020 indicators - education]] [[Category:<Statistical article>|Europe 2020 indicators - education]]
