Archive:The EU in the world - living conditions
- Data from June - July 2012. Most recent data: Further Eurostat information, Main tables and Database.
This article is part of a set of statistical articles based on Eurostat publication The EU in the world 2013.
The article focuses on the education and training statistics in the European Union (EU) and in the 15 non-EU countries from the Group of Twenty (G20). It covers a range of subjects, including: expenditure, personnel, participation rates and attainment and gives an insight into the European economy and society in comparison with the major economies in the rest of the world, especially with the EU's counterparts in the so-called Triad, the US and Japan, and with the BRIC countries Brazil, Russia, India and China (or BRICS if South-Africa is also included).

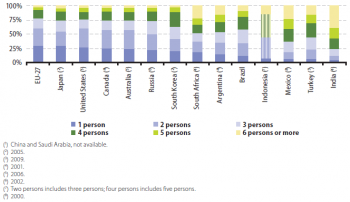
(% of total)
Source: Eurostat (ilc_lvph03), the United Nations Department of Economic and Social Affairs (Demographic statistics) and national surveys

(% of total household consumption expenditure)
Source: Eurostat (hbs_str_t211), the United Nations Statistics Division (Economic Statistics Branch) and national household surveys

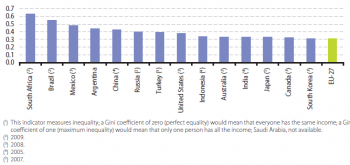
(ratio)
Source: Eurostat (ilc_di11), the World Bank (Poverty and Inequality Database) and the OECD (Income Distribution and Poverty)

(ratio)
Source: Eurostat (ilc_di11), the World Bank (Poverty and Inequality Database) and the OECD (Income Distribution and Poverty)

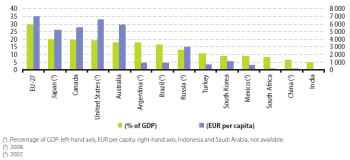
Source: Eurostat (spr_exp_sum), the OECD (Social Expenditure Database) and the International Labour Organisation (Social Security Department)
Main statistical findings
<description and/or analysis of most important statistical data, illustrated by tables and/or figures and/or maps>
Data sources and availability
The statistical data were mainly extracted during June and July 2012.
The indicators are often compiled according to international – sometimes global – standards, for example, UN standards for national accounts and the IMF’s standards for balance of payments statistics. Although most data are based on international concepts and definitions there may be certain discrepancies in the methods used to compile the data.
EU‑27 and euro area data
Almost all of the indicators presented for the EU‑27 and EA-17 aggregates have been drawn from Eurobase, Eurostat’s online database. Eurobase is updated regularly, so there may be differences between data appearing in this publication and data that is subsequently downloaded. In exceptional cases some indicators for the EU have been extracted from international sources, for example, when values are expressed in purchasing power parities. Otherwise, European Commission sources have been used.
G20 countries from the rest of the world
For the 15 G20 countries that are not members of the EU, the data presented have generally been extracted from a range of international sources listed in the Introduction. In a few cases the data available from these international sources have been supplemented by data for individual countries from national statistics authorities. For some of the indicators a range of international statistical sources are available, each with their own policies and practices concerning data management (for example, concerning data validation, correction of errors, estimation of missing data, and frequency of updating). In general, attempts have been made to use only one source for each indicator in order to provide a comparable analysis between the countries.
Context
<context of data collection and statistical results: policy background, uses of data, …>
Further Eurostat information
Publications
- Key data on education in Europe 2012
- The EU in the world 2013
- The European Union and the BRIC countries
Main tables
- Title(s) of second level folder (if any)
- Title(s) of third level folder (if any)
Database
- Title(s) of second level folder (if any)
- Title(s) of third level folder (if any)

