Archive:The EU in the world - population
- Data from Month Year. Most recent data: Further Eurostat information, Main tables and Database.
<Introduction: simple language, not too long, kind of executive summary>
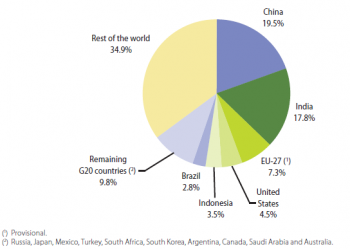
(%)
Source: Eurostat online data code (demo_gind) and the United Nations Department of Economic and Social Affairs (World Population Prospects: the 2010 Revision)
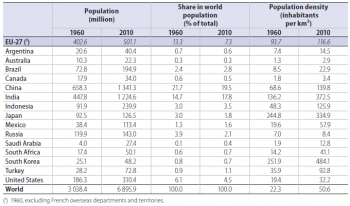
Source: Eurostat online data codes (demo_gind) and (tps00003) and the United Nations Department of Economic and Social Affairs (World Population Prospects: the 2010 Revision)
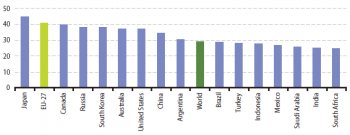
(years)
Source: Eurostat online data code (demo_pjanind) and the United Nations Department of Economic and Social Affairs (World Population Prospects: the 2010 Revision)
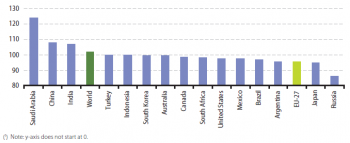
(men per 100 women)
Source: Eurostat online data code (demo_pjangroup) and the United Nations Department of Economic and Social Affairs (World Population Prospects: the 2010 Revision)
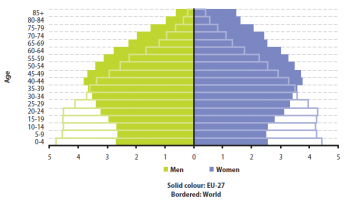
(% of total population)
Source: Eurostat online data code (demo_pjangroup) and the United Nations Department of Economic and Social Affairs (World Population Prospects: the 2010 Revision)
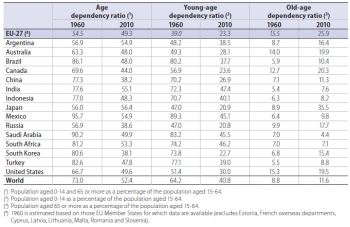
(% of the population aged 15-64)
Source: Eurostat online data codes (demo_pjan) and (demo_pjanind) and the United Nations Department of Economic and Social Affairs (World Population Prospects: the 2010 Revision)
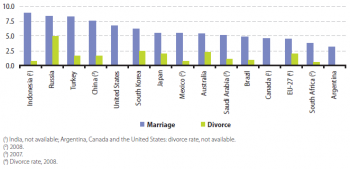
(per 1 000 population)
Source: Eurostat online data codes (demo_nind) and (demo_ndivind) and the United Nations Department of Economic and Social Affairs (Demographic Yearbook)

(boys per 100 girls)
Source: Eurostat online data code (demo_fasec) and the United Nations Department of Economic and Social Affairs (World Population Prospects: the 2010 Revision)
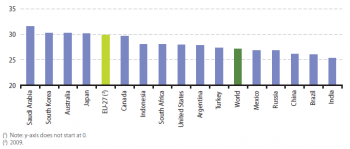
(years)
Source: Eurostat online data code (demo_find) and the United Nations Department of Economic and Social Affairs (World Population Prospects: the 2010 Revision)
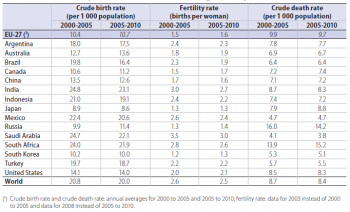
Source: Eurostat online data codes (demo_gind) and (demo_find) and the United Nations Department of Economic and Social Affairs (World Population Prospects: the 2010 Revision)
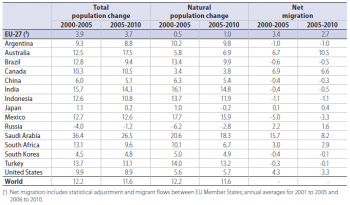
(per 1 000 population)
Source: Eurostat online data code (demo_gind) and the United Nations Department of Economic and Social Affairs (World Population Prospects: the 2010 Revision)
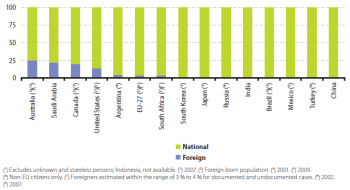
(% of total)
Source: Eurostat online data code (migr_pop1ctz), the United Nations Department of Economic and Social Affairs (Demographic Statistics), the OECD (International Migration Data 2011) and national census results
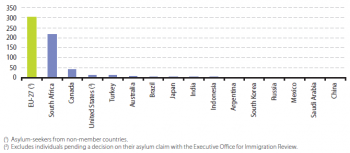
(1 000 applicants)
Source: Eurostat online data code (migr_asyappctza) and the United Nations High Commissioner for Refugees (UNHCR Statistical Online Population Database)
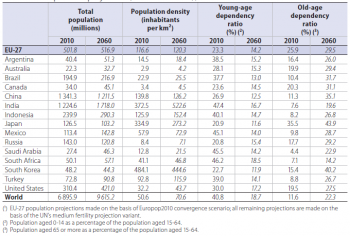
Source: Eurostat online data codes (demo_gind), (tps00003), (demo_pjan), (demo_pjanind), (proj_10c2150p) and the United Nations Department of Economic and Social Affairs (World Population Prospects: the 2010 Revision)
Main statistical findings
<description and/or analysis of most important statistical data, illustrated by tables and/or figures and/or maps>
Text with Footnote [1]
Subdivision 1
Subdivision 2
Data sources and availability
<description of data sources, survey and data availability (completeness, recency) and limitations>
Context
<context of data collection and statistical results: policy background, uses of data, …>
Further Eurostat information
Publications
Main tables
- Title(s) of second level folder (if any)
- Title(s) of third level folder (if any)
Database
- Title(s) of second level folder (if any)
- Title(s) of third level folder (if any)
Dedicated section
Methodology / Metadata
<link to ESMS file, methodological publications, survey manuals, etc.>
- Name of the destination ESMS metadata file (ESMS metadata file - ESMS code, e.g. bop_fats_esms)
- Title of the publication
Source data for tables, figures and maps (MS Excel)
Other information
<Regulations and other legal texts, communications from the Commission, administrative notes, Policy documents, …>
- Regulation 1737/2005 (generating url [http://eur-lex.europa.eu/LexUriServ/LexUriServ.do?uri=CELEX:32005R1737:EN:NOT Regulation 1737/2005]) of DD Month YYYY on ...
- Directive 2003/86/EC (generating url [http://eur-lex.europa.eu/LexUriServ/LexUriServ.do?uri=CELEX:32003L0086:EN:NOT Directive 2003/86/EC]) of DD Month YYYY on ...
- Commission Decision 2003/86/EC (generating url [http://eur-lex.europa.eu/LexUriServ/LexUriServ.do?uri=CELEX:32003D0086:EN:NOT Commission Decision 2003/86/EC]) of DD Month YYYY on ...
<For other documents such as Commission Proposals or Reports, see EUR-Lex search by natural number>
<For linking to database table, otherwise remove: {{{title}}} ({{{code}}})>
External links
See also
Notes
- ↑ Text of the footnote.
[[Category:<Under construction>|Name of the statistical article]]
[[Category<Subtheme category name(s)>|Name of the statistical article]] [[Category:<Statistical article>|Name of the statistical article]]
