File:Average hours actually worked, by NUTS 1 regions, 2008.PNG
Size of this preview: 596 × 600 pixels. Other resolutions: 239 × 240 pixels | 809 × 814 pixels.
Original file (809 × 814 pixels, file size: 172 KB, MIME type: image/png)
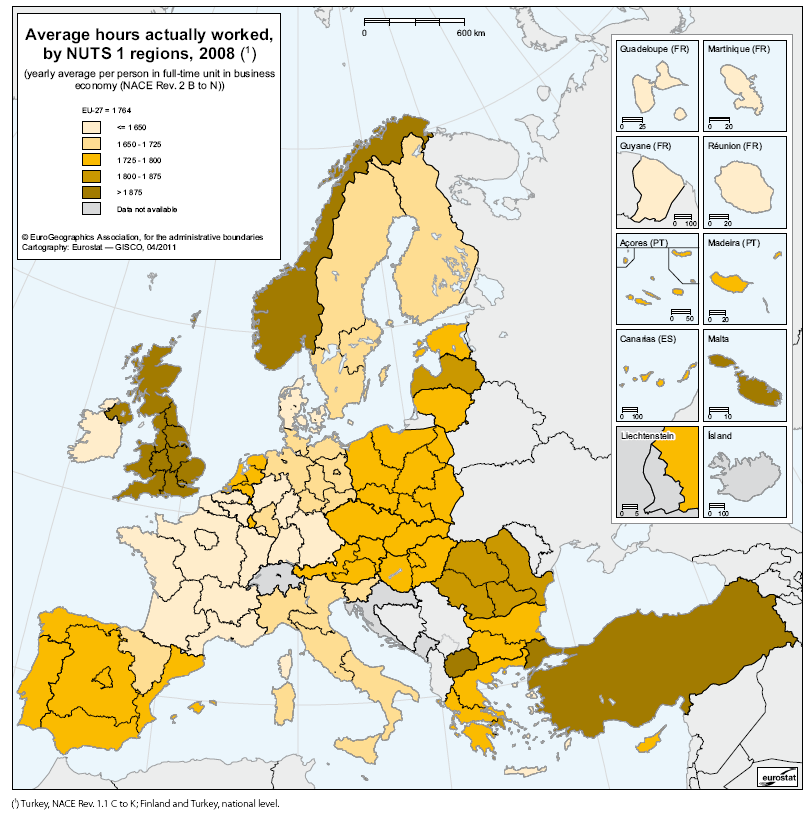
Average hours actually worked, by NUTS 1 regions, 2008
- (yearly average per person in full-time unit in business economy (NACE Rev. 2 B to N))
Map created with data from March 2011
Most recent data available now, see:
File usage
The following page uses this file: