Archive:Phosphorus balance in agriculture
Data from September 2011, most recent data: Gross Nutrient Balance
Between 2005 and 2008, the Gross Phosphorus Balance for the EU27 remained relative stable with an estimated average of 2 kg Phosphorus (P) per ha. In the EU15 the Gross Phosphorus Balance reduced slightly from an estimated average of 5 kg P per ha in the period 2000-2004 to an estimated average of 3 kg P in the period 2005-2008. In the ten former Central and Eastern European (CEC) Countries (PL, SI, SK, EE, LT, LV, CZ, HU, RO and BG) the Gross Phosphorus Balance was much lower than in the EU-15, with an estimated average of 0 kg/ha over the period 2005-2008.
All the figures in this article are presented as averages over a period of 5 years. Meteorological conditions have a big impact on the annual estimated Gross Phosphorus Balances. The amount of nutrients removed with the harvest and grazing of crops and fodder, is depending on the nutrient content of crops and fodder and the yields of crops and fodder. The nutrient content of fodder and crops is estimated to be more or less constant in most countries. The amount of nutrients removed with the harvest and grazing of crops and fodder is therefore mainly depending on yields. Yields are depending on farmer practices (like pesticide and fertiliser use, irrigation etc) and on meteorological conditions. Metereological conditions vary significantly from year to year and these fluctuations can also be seen in the estimated nutrient output and surplus. In 2003 and 2007 for instance, large parts of Europe were hit by extreme weather causing significant drops in crop production, a peak in the balance can be noted for these years in some Member States. Variations in the nutrient surplus between years should therefore be interpreted with care. To limit the impact of metereological conditions on the trend, the trend can best be analysed looking at averages over a period of a few years.
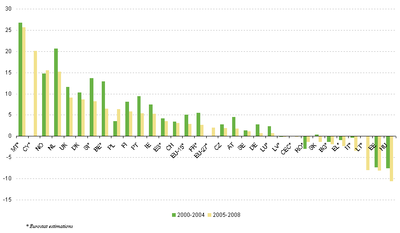
The Gross Phosphorus Balance is high in the Mediterranean islands MT and CY and Northwest-Europe (NO, NL, UK, DK) while the balance is negative for IT and GR and many of the former CEC countries. Figure 1 shows the average Gross Phosphorus Balance per hectare of agricultural land (the total of arable land, land under permanent crops and permanent grassland) for the periods 2000-2004 and 2005-2008. The
Gross Phosphorus Balance per ha decreased in most countries in 2005-2008 compared to 2000-2004, exceptions were PL and NO. Data for CY and EE were not available for 2000-2004.
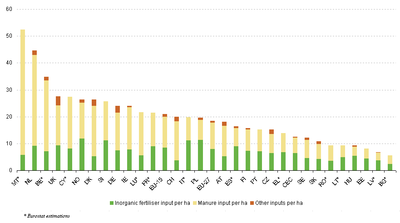
Many of the countries with a high average Phosphorus surplus between 2005 and 2008 also have a relative high P input per ha (for instance NL, MT), see Figure 2. A high input does however not necessarily lead to a high Phosphorus balance, as the balance is also determined by the output. The Phosphorus input per ha of BE in 2005-2008 (estimated at 35 kg P per ha) for instance is higher than that of NO (estimated at 26 kg P per ha), but due to a much higher P output per ha the P surplus of BE (estimated at 6 kg P per ha) is less than half of the P surplus of NO (estimated at 15 kg P per ha).
Inorganic Fertilisers and manure account for more than 95% of the P input in the EU27 between 2005 and 2008. At the moment the re-use of P through the use of compost, sewage sludge, industrial waste etc is at the moment insignificant. Data on other organic fertilisers are however lacking in many countries, therefore the significance of these fertilisers could be underestimated.
The choice of fertilizer type (manure, mineral fertilizers, other organic fertilizers) has different impacts on the environment:
- The P in manure and fertilizers is not available to the plant in the same rate for different types of manure and fertilizers.
- The production of P fertilisers contributes to GHG emissions (though some studies show a net GHG emissions benefit for certain production techniques).
- Mineral P fertilisers are produced from natural resources which are limited available and depleting.
- Other potential fertilisers like urban wastes often include health hazards (to both plants and humans) and procedures commonly used to reduce these hazards - such as composting - tend to reduce the fertilizer value.
The share of manure in total inputs is on average for 2005-2008 smaller in the former Central and Eastern European Countries (46%) than in the EU15 (55%). Manure withdrawals and imports are only of significance (>5% of total manure production) in a very few countries (BE, NL, HU). This means that for most countries the manure used is mainly determined by the amount of manure produced in the country. The manure production in kg P per ha is twice as high on average in the EU15 as in the former Central and East European countries in the period 2005-2008. The manure production is determined by the amount and type of livestock in the country. Figure 4 in Agri-environmental statistics shows the livestock density in the EU in 2007. MT, NL, BE, DK, CY and IE have the highest livestock densities
and also belong to the countries with the highest rates of manure input per ha (>=15 kg P per ha). BG, LT, EE and LV belong to the countries with the lowest livestock densities and also belong to the countries with the lowest rates of manure input per ha (<5 kg P per ha). The countries with the highest livestock densities belong also to the countries with a high share of manure in total input (>=2/3).
The dependence on mineral fertilisers for P input is stronger in the CEC (51% of total P input) than in the EU15 (41%) on average in 2005-2008. There are however big differences between countries; The share of inorganic fertilisers in total P inputs is larger than 50% in HU, PL, IT, LV, ES, ES, EE, LT,
while the share in the NL, BE, DK and MT is below 25%. These figures should however be taken with care as the estimation of the P input of manure is largely depending on the excretion coefficients used to convert animal numbers in P manure production. For many countries these coefficients were not available and have been estimated by Eurostat.
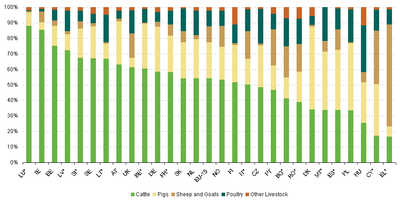
Figure 4 shows that cattle contributes the most to P manure production and over 50% in most countries except in DK (where pigs have the highest share), in CZ, PT, PL, MT, ES, HU, BG, RO, and CY (where different livestock types are important), and in GR (where sheep and goats have the highest share).
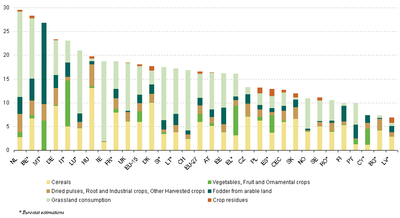
The removal of P with harvest and grazing of crops and forage per ha varies between crops and countries as can be seen in Figure 5. Grassland and cereals production have the highest P removal rates per ha, though great variation exists between countries due to differences in yields and P content per tonne of product. The P content per tonne product is among others depending on farmer practices like fertilisation, irrigation, mowing vs grazing etc.
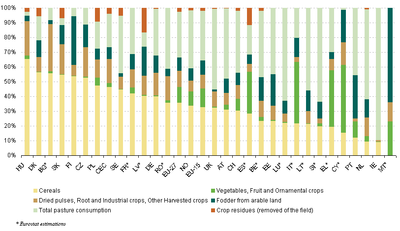
The dominant share of total P output in the EU27 (2005-2008) is the uptake of P with cereal production (36%) and grassland (31%), see Figure 6. P output is depending on cropping patterns, yields, farm management practices (tillage, irrigation etc), climate etc. Figure 1 in Agri-environmental statistics shows the cropping pattern in 2007, permanent and temporary grassland covered 39% of the UAA in 2007 (38% in 2005) and cereals 34% (same as 2005). There are however significant differences between countries, in some countries (for example UK, SI, IE, NO) grassland dominates the UAA, where for instance in BG, HU and DK cereals are the dominating crop. Permanent crops are significant in Mediterranean countries.
Data sources and availability
<description of data sources, survey and data availability (completeness, recency) and limitations>
Context
<context of data collection and statistical results: policy background, uses of data, …>
Further Eurostat information
Publications
Main tables
- Title(s) of second level folder (if any)
- Title(s) of third level folder (if any)
Database
- Title(s) of second level folder (if any)
- Title(s) of third level folder (if any)
Dedicated section
Methodology / Metadata
<link to ESMS file, methodological publications, survey manuals, etc.>
- Name of the destination ESMS metadata file (ESMS metadata file - ESMS code, e.g. bop_fats_esms)
- Title of the publication
Source data for tables, figures and maps on this page (MS Excel)
Other information
<Regulations and other legal texts, communications from the Commission, administrative notes, Policy documents, …>
- Regulation 1737/2005 of DD Month YYYY on ...
- Directive 86/2003 of DD Month YYYY on ...
- Commission Decision 86/2003 of DD Month YYYY on ...
<For other documents such as Commission Proposals or Reports, see EUR-Lex search by natural number>
<For linking to database table, otherwise remove: {{{title}}} ({{{code}}})>
External links
See also
Notes
[[Category:<Subtheme category name(s)>|Statistical article]] [[Category:<Statistical article>|Statistical article]]
