World trade in goods
Data extracted in June 2024.
Planned update: no update planned.
Highlights
member
The EU accounted for 13.2% of world exports and 14.8% of world imports in goods in 2022.
The EU was the world's leading exporter of food, drinks and tobacco as well as of chemical products in 2022 but was highly dependent upon imports of mineral fuels.
In 2022, the United States was the principal destination for goods exported from the EU and China the main source of goods imported into the EU.
(%)
Source: Eurostat (ext_lt_introeu27_2020), United Nations (Comtrade) and International Monetary Fund (Direction of Trade Statistics)
Globalisation patterns in EU trade and investment is an online Eurostat publication presenting a summary of recent European Union (EU) statistics on economic aspects of globalisation, focusing on patterns of EU trade and investment.
Patterns of international trade in goods have seen wide-ranging changes in recent decades reflecting, among others: trade liberalisation, the introduction of new technologies, different methods of industrial organisation and the development of global production chains. The relocation of some manufacturing activities has led to a shift in the composition of international trade, reflected in a higher share of total trade for intermediate goods (processed materials, parts and components), and lower shares for final (consumer) goods.
Statistics on international trade in goods
Note that the information presented in the overview article is based on statistics from the balance of payments (BOP) domain, while the statistics presented in this article are based on international trade in goods statistics (ITGS). There are a number of differences between the recommendations for international trade in goods statistics and the goods account of the balance of payments, for example in terms of coverage, the time of recording, or methods of valuation. These differences and adjustments may have a substantial effect on the final reporting of figures for these two distinct sources. Moreover, the data collection exercise for international trade in goods statistics is far more detailed, literally covering thousands of individual products. That said, in many countries one of the most important uses of international trade in goods statistics is as a data source for estimating components of the balance of payments and national accounts.
It is also important to note that changes in business models have implications for the collection and the reliability of international trade in goods statistics. For example, new forms of industrial organisation have led to an increasing share of intermediate goods being traded within and between enterprises as part of global value chains: these flows continue to be assessed as gross measures, which may appear to 'inflate' trade values, especially when intermediate goods are counted several times as they cross borders as part of intricate production chains (for example, as in the aerospace or motor vehicles industry).
Full article
World trade in goods: developments between 2012 and 2022
In 2022, extra-EU trade accounted for 13.2% of world exports and 14.8% of world imports in goods
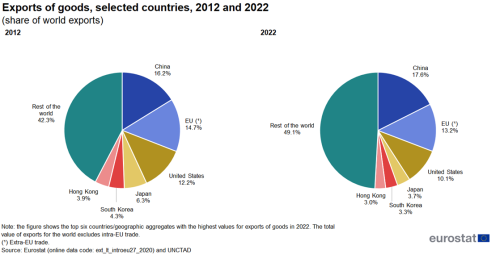
Figures 1 and 2 provide information on the share of world exports and imports of goods, showing developments between 2012 and 2022. The share of Chinese exports rose from 16.2% of the total value in 2012 to 17.6% by 2022 while the other five economies shown all saw their share falling.
While China was the leading exporter of goods in 2022 (€3.4 trillion), the United States was the largest importer of goods (€3.2 trillion); the EU occupied the second position for both exports of goods, valued at €2.6 trillion and imports of goods, valued at €3.0 trillion (see also Table 2). The EU, China and the United States have been the three largest global players for international trade in goods since 2004 (when China passed Japan). In 2007, China surpassed the United States as the second largest exporter of goods in the world and in 2014 China overtook the EU to record the highest share of exported goods, a position that it has since maintained.
The EU's share of the global exports of goods decreased from 14.7% in 2012 to 13.3% by 2022, while the share of the United States dropped from 12.2% to 10.1%. The shares in global exports from Japan, South Korea and Hong Kong also contracted.

(%)
Source: Eurostat (ext_lt_introeu27_2020) and UNCTAD
Between 2012 and 2022 the EU's share of global imports increased
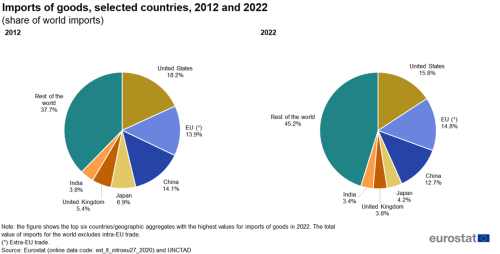
Among the six largest importers of goods, the EU was the only whose share in global imports grew between 2012 (13.9%) and 2022 (14.8%), gaining 0.9 percentage points (pp). The import shares for the United States (-2.4 pp), China (-1.4 pp), Japan (-2.7 pp), the United Kingdom (-1.5 pp) and India (-0.4 pp) all decreased.
(%)
Source: Eurostat (ext_lt_introeu27_2020) and UNCTAD
In 2022, the Chinese trade surplus for goods was €833 billion
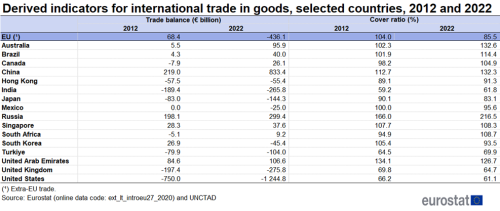
Table 1 compares the trade balance and cover ratio for international trade in goods in 2012 with 2022. Six countries had a trade surplus both in 2012 and 2022: Australia, Brazil, China, Russia, Singapore and the United Arab Emirates. For all of them the surplus increased over this period, with the largest increase (+€614 billion) for China who also had the largest surplus in 2022 (€833 billion). In contrast the United States (€1 245 billion) had the largest deficit. The largest decrease of the trade balance was recorded by the EU who turned a surplus of €68 billion into a deficit of €436 billion, a change of €504 billion. South Korea also moved from a surplus to a deficit while Canada and South Africa turned their deficits into surpluses. Finally, Hong Kong, India, Japan, Mexico, Türkiye, the United Kingdom and the United States had deficits in both years.
While the trade balance provides information on the absolute value of trading positions, the cover ratio provides a relative measure that is based on the ratio (expressed in percentage terms) between the value of exports and the value of imports; when exports are higher than imports then the cover ratio is above 100%. In 2022, the highest cover ratios for international trade in goods were recorded for Russia (216.5%), Australia (132.6%) and China (132.3%). Cover ratios for these countries were higher in 2022 than they had been in 2012, confirming that their trade surplus for trade in goods were continuing to expand not only in absolute terms but also in relative terms, as export growth outstripped import growth.
By contrast, the lowest cover ratios for international trade in goods were recorded in the United States (61.1%), India (61.8%), the United Kingdom (64.7%) and Turkey (69.9%).
Source: Eurostat (ext_lt_introeu27_2020) and UNCTAD
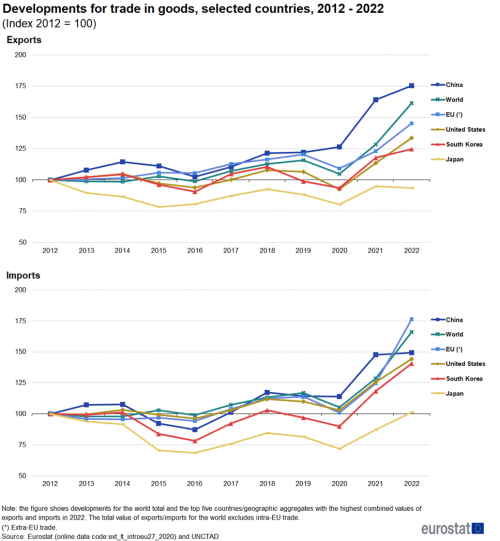
Figure 3 shows the development of imports and exports of the world and of the five economies with the highest combined imports and exports from 2012 to 2022. Between 2012 and 2015 developments were somewhat irregular and in 2016 exports and imports for all economies were below 2012 levels, except for exports from China and the EU. Between 2016 and 2019 exports and imports for all five economies increased. In 2020, the COVID-19 pandemic caused imports and exports for all economies to fall, with the exception of exports from China. However, in 2021 all five economies surpassed their 2019 levels of imports and exports and this growth continued in 2022 except for exports from Japan.
(2010 = 100)
Source: Eurostat (ext_lt_introeu27_2020) and UNCTAD
International trade in goods by product
In 2022, the EU was the world's leading exporter of food, drinks and tobacco as well as of chemical products …
Table 2 details the leading global exporters and importers for a range of different product groups (based on the standard international trade classification (SITC Rev. 4) of the United Nations). In 2022, the EU had the highest value of exports for food, drinks and tobacco as well as for chemicals and related products, whereas China was the leading exporter for machinery and transport equipment and for other manufactured goods, whilst the United States was the leading exporter for mineral fuels and lubricants and Australia for raw materials.
… but was highly dependent upon imports of mineral fuels.
In 2022, the EU had the highest level of imports for mineral fuels and lubricants and second highest for raw materials, reflecting its high level of dependency for these goods with China having the second highest level of imports for mineral fuels and lubricants and highest for raw materials. The United States had the highest share of global imports for the other five categories.

(€ billion)
Source: Eurostat (ext_lt_intertrd) and UNCTAD
While the leading global exporters and importers in absolute terms are unsurprisingly some of the largest economies, Table 3 provides an alternative analysis focusing on relative specialisation ratios. These are based on the share of total exports/imports accounted for by a particular product, comparing the shares of one country with the average share for all 16 reporting countries/geographical aggregates analysed in this article (see Table 1 for the list). For example, the share of raw materials in the total value of goods exported by Australia in 2022 was 4.8 times as high as the average share for the 16 reporting countries, while the share of raw materials in the total value of goods imported by China was 3.4 times as high as the average.
The results based on this relative measure show a greater variation than the absolute levels of trade shown in Table 1. It shows Brazil being the most specialised country for exporting food, drinks and tobacco, Australia for raw materials, Russia for mineral fuels and lubricants, the EU for chemicals and related products, Türkiye for other manufactured goods and Hong Kong for machinery and transport equipment.
On the import side it shows Russia being the most specialised country for food, drinks and tobacco, China for raw materials, India for mineral fuels and lubricants, Brazil for chemicals and related products, the United States for other manufactured goods and Hong Kong for machinery and transport equipment.

(%, average = 100)
Source: Eurostat (ext_lt_intertrd) and UNCTAD
Developed economies often specialise in exporting high value goods, while emerging economies tend to focus on exporting natural resource endowments or lower value goods
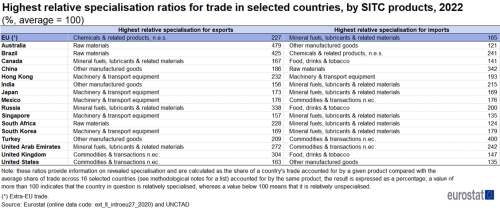
Table 4 reverses the focus of the analysis, detailing for each country where its relative trade specialisation lies. The information presented confirms the role played by the natural endowments of particular goods. For example, Australia, Brazil and South Africa were all relatively specialised in exporting raw materials, whereas these products accounted for the highest import specialisation ratio in China. It is also interesting to note that while several developed economies were relatively specialised in exporting high value goods (chemicals and related products, machinery and transport equipment and other manufactured goods), their highest import specialisation ratios were recorded for more basic goods (mineral fuels and lubricants, food, drinks and tobacco and raw materials).
(%, average = 100)
Source: Eurostat (ext_lt_maineu) and UNCTAD
International trade in goods by partner
Traditionally, trade in high value goods was relatively concentrated between developed economies, while international trade flows between the developing and developed world were largely concentrated on the supply of raw materials and basic goods (such as food). However, globalisation has resulted in some changes to the geographical orientation of trade, through the emergence of new trading relationships, often at the expense of trade with more developed economies.
The rapid growth of China in terms of its integration into the global economy during the last couple of decades was given added impetus by China's accession to the World Trade Organisation (WTO) in 2001. Within the context of globalisation, it is important to note that China often plays a role as a 'hub' for global production chains, often importing semi-finished (intermediate) goods before assembling finished goods for re-export. As such, trade flows with China may in some cases be interpreted as flows that represent a wider Asian region, insofar as China sources many of its intermediate parts/components from its surrounding economies.
In 2022, the United States was the principal destination for goods exported by the EU
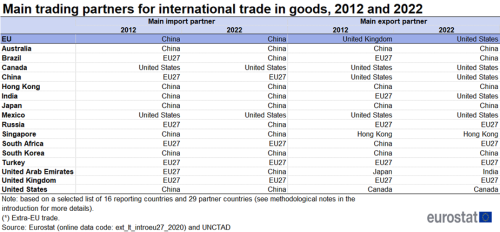
Table 5 shows bilateral trade relationships for goods in 2012 and 2022 and confirms the rise of China as a trading power. In 2012 it already appeared eight times as main export partner and five times as main import partner for the countries in the table. By 2022 this had grown to eleven top positions for exports and remained five for imports. By contrast, the EU lost its top position as main export partner for Brazil and India to China and the United States respectively. For imports the EU appeared seven times as top partner in 2012. In 2022 three of those, namely Brazil, Russia and the United Arab Emirates went to China. Apart from the size of an economy, the position of top import or export partner is also influenced by the proximity of countries. Examples of this are the United States - Mexico - Canada; the EU - United Kingdom - Russia; and Singapore - Malaysia - China.
Source: Eurostat (ext_lt_intertrd) and UNCTAD
The EU economy is one of the most 'open' global economies with import tariffs on industrial products among some of the lowest in the world. For example, in 2022 only 3.9% of non-agricultural products faced import duties in excess of 15% (see Table 6). The EU also has a comprehensive network of arrangements for preferential trade that goes beyond more general WTO rules, for example, giving many developing countries preferential access to its markets for 'everything but arms'.
Source data for tables, figures and maps (MS Excel)
Direct access to
