Archive:Business economy - structural profile
Data from March 2011, most recent data: Further Eurostat information, Main tables and Database
This article belongs to a set of statistical articles which analyse the structure, development and characteristics of the various economic activities in the European Union (EU). The present article is part of the business economy overview, and covers the structural profile of the business economy.

Source: Eurostat (sts_inpr_q), (sts_inppd_q), (sts_inlb_q)
Source: Eurostat (sts_inpr_a)
Source: Eurostat (sts_inpr_a)

Source: Eurostat (sts_copr_q)
Source: Eurostat (sts_trtu_q), (sts_setu_q)

Source: Eurostat (sts_trtu_a)

Source: Eurostat (sbs_na_ind_r2), (sbs_na_con_r2), (sbs_na_dt_r2), (sbs_na_1a_se_r2)
Source: Eurostat (sbs_na_ind_r2), (sbs_na_con_r2), (sbs_na_dt_r2), (sbs_na_1a_se_r2)
Source: Eurostat (sbs_na_ind_r2), (sbs_na_con_r2), (sbs_na_dt_r2), (sbs_na_1a_se_r2)

Source: Eurostat (sbs_na_ind_r2), (sbs_na_con_r2), (sbs_na_dt_r2), (sbs_na_1a_se_r2)
Source: Eurostat (sbs_na_ind_r2), (sbs_na_con_r2), (sbs_na_dt_r2), (sbs_na_1a_se_r2)
Main statistical findings
Developments in the EU business economy
The indicators presented at the start of this chapter are derived from short-term statistics (STS). Within the industrial economy the index of production is the leading measure of output, presenting the development of value added at constant prices. Figure 2.1 clearly shows the scale of the impact of the financial and economic crisis in 2008 and 2009 on the EU-27 industrial economy. From its pre-recession high in the first quarter of 2008 to the bottom of the cycle in the second quarter of 2009, the index of production fell by 18.1 %. The subsequent rebound in activity resulted in EU-27 industrial output returning to its average level for 2005 by the final quarter of 2010, while industrial employment appeared to have stabilised about 10 % below its pre-recession level.
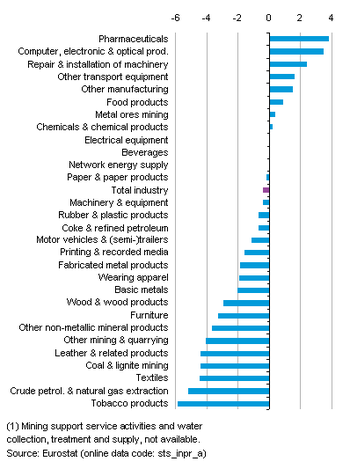
Some of the biggest reductions in EU-27 output were registered for traditional manufacturing activities (tobacco products, textiles, leather, wood and furniture), while the level of output was less affected for activities with a higher level of technology (pharmaceuticals, computers, electronic and optical products), as well as for activities characterised as producing ‘necessity’ goods or goods where demand may be expected to be less affected or even rise during a recession (food products, repair and installation of machinery) – see Figure 3.
While there were signs that the recovery was underway by 2010 for most industrial activities, EU-27 indices of production for building and civil engineering continued to follow a downward path. The index of production for construction peaked in the first quarter of 2008 (the same date as for total industry), since when it has fallen each and every quarter apart from a temporary respite in the second quarter of 2010. Output in the final quarter of 2010 was 18.3 % below its pre-recession high – see Figure 4. The relative stability of civil engineering output through much of 2008 and 2009 during the financial and economic crisis may reflect infrastructure projects having considerable lead-in times (with the work spread over many years), as well as these projects being largely financed by the public sector (where spending was often maintained or increased during the recession). Nevertheless, it would appear that fewer civil engineering projects have been undertaken since the start of 2010, perhaps reflecting government concerns with controlling public finances.
The slowdown in building activity reflected a downturn in property markets and house buyer confidence, as well as a change in the attitude of banks and other lenders, as they were less willing to lend capital without more stringent conditions on making credit available. Many housing/property markets remained subdued during 2010.
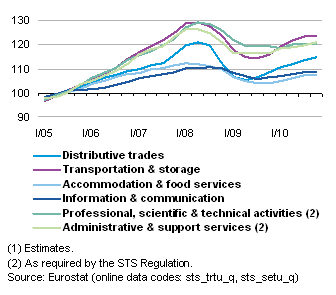
The turnover index reflects market sales of goods or services to third parties. The effects of the financial and economic crisis were generally less acute within the services sector, as demonstrated by the smoother development of EU-27 turnover indices. In contrast to output measures for industry or for construction, the turnover indices for a range of services (shown in Figure 5) never fell below their average levels for 2005, although it should be stressed that the turnover indices are in current prices and so reflect price changes as well as the volume of output.
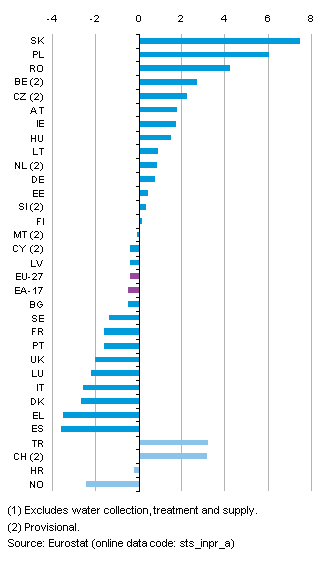
Services, as covered by the STS Regulation, saw their sales decline in the EU-27 by 10.8 % between the second quarter of 2008 and the third quarter of 2009. The biggest contractions in turnover (among the NACE sections shown in Figure 5) were recorded for distributive trades (in particular, the retail sale of motor vehicles) and for transportation and storage (in particular, air transport), while information and communication services was the activity that was least affected by the downturn. Figure 2.6 shows that Ireland and Spain were the only Member States to record lower turnover indices for services in 2010 than they had five years earlier (-1.6 % and -1.0 % per annum). EU-27 sales rose on average by 2.5 % per annum during the period under consideration, with the fastest expansions in Romania, Poland, Bulgaria, Luxembourg and the United Kingdom (all above 5 % growth per annum) – see Figure 6.
Size and structure of the non-financial business economy
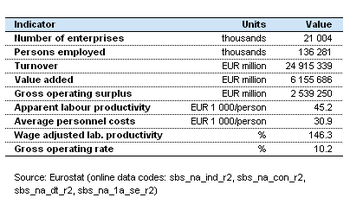
In 2008 a total of EUR 6 155 700 million of gross value added was generated in the EU-27’s non-financial business economy, which was equivalent to 63.4 % of the whole economy’s value added at factor cost. The non-financial business economy workforce reached 136.3 million persons employed, around three fifths (60.2 %) of those employed in the EU-27.
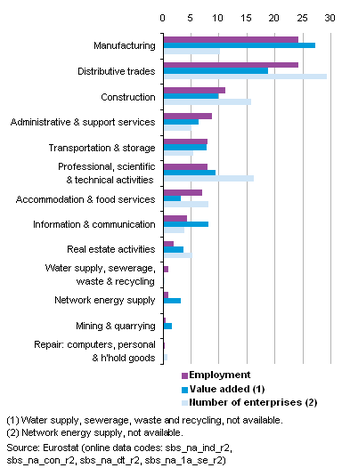
The sectors that make up the non-financial business economy are shown in Figure 2.7 which provides an overview of their contribution in terms of labour input (employment), output (value added), and the enterprise population. In broad terms, manufacturing and distributive trades were the largest sectors, combining for two fifths or more of each of the three indicators.
Apparent labour productivity averaged EUR 45 200 per person employed in the EU-27’s non-financial business economy in 2008, ranging from EUR 20 000 per person employed in accommodation and food services to EUR 151 000 per person employed in mining and quarrying. Average personnel costs were also lowest in the accommodation and food services sector (EUR 16 000 per employee), and joint highest in network energy supply and information and communication services (around EUR 50 000 per employee); the non-financial business economy average was EUR 31 000 per employee. It should be noted that both of these indicators are based on a simple head count of employment and so are influenced, at least in part, by the extent of part-time employment. The influence of part-time employment is largely removed by combining these two measures into the wage adjusted labour productivity ratio: for the non-financial business economy this ratio was valued at 146.3 %, indicating that average labour productivity was 46.3 % higher than average personnel costs. This indicator was below 100 % for the small sector of repair of computers, personal and household goods, and rose as high as 430 % for the mining and quarrying sector.
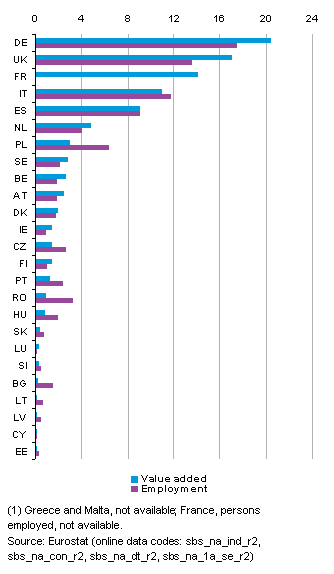
As can be seen from Figure 8 a Member State’s share of the EU-27’s non-financial business economy varies substantially depending whether it is measured in terms of value added or employment. Those with higher shares of EU-27 value added than the workforce (such as Germany and the United Kingdom) had above average apparent labour productivity.
Data sources and availability
The main part of the analysis in this article is derived from structural business statistics (SBS), including core, business statistics which are disseminated regularly, as well as information compiled on a multi-yearly basis, and the latest results from development projects.
Other data sources include the PRODCOM statistics on the production of manufactured goods.
Context
Regulation ((EC) No 58/1997) established a common framework for the collection, compilation, transmission and evaluation of Community statistics on the structure, activity, competitiveness and performance of businesses in the Community. These structural business statistics (SBS) constitute the principal source of information used in the structural business statistics articles. The main SBS aggregates, often referred to in these articles, include:
- the non-financial business economy (NACE Rev. 1.1 Sections C to I and K);
- industry (NACE Rev. 1.1 Sections C to E);
- construction (NACE Rev. 1.1 Section F);
- non-financial services (NACE Rev. 1.1 Sections G to I and K).
Note that financial services (NACE Rev. 1.1 Section J) are kept separate (see Financial and insurance sector statistics) because of their specific nature and the limited availability of most standard business statistics in this area.
The legislation in respect to structural business statistics was modified in 2002 by a Decision (No 2367/2002/EC) of the European Parliament and the Council in order to ensure that the collection of statistics was guided by the principal Community policy priorities of economic and monetary union, enlargement and competitiveness, regional policy, sustainable development and the social agenda.
A recast structural business statistics Regulation ((EC) No 295/2008) came into force in February 2008 and provides ten modules for the production of business statistics. The regulation foresees that the first reference year for which statistics will generally be compiled is calendar year 2008; in addition the statistics should be collected according to the revised classification of economic activities (NACE Rev. 2). This recast Regulation should provide for the continuation of existing statistical support in current policy areas and satisfy additional requirements arising from new Community policy initiatives, as well as reviews of statistical priorities. The Member States will generally have 18 months to deliver these statistics to Eurostat and hence the data for 2008 is expected to be available by the summer of 2010. As such, the structural business statistics articles continue to present data using the NACE Rev. 1.1 classification of economic activities.
Further Eurostat information
Publications
- European Business: Facts and figures - 2009 edition
Main tables
Database
Dedicated section
Other information
- Regulation 58/1997 of 20 December 1996 concerning structural business statistics
- Decision 2367/2002/EC of 16 December 2002 on the Community statistical programme 2003 to 2007
- Regulation 295/2008 of 11 March 2008 concerning structural business statistics