Archive:Electric vehicles and energy generation statistics
Data extracted in March 2023.
Planned article update: March 2024.
Highlights
This article sheds light on electricity generation and transport data for electric vehicles. It covers the European Union (EU) and when available, it also includes data from Iceland, Liechtenstein, Norway and Switzerland. Transport is one area where electricity consumption will increase cobsiderably in the future. The first part of the article describes passenger electric trends at county level. The second part analyses electricity generation data and relates it to the e-vehicles consumption. Electricity generation mix is a good proxy of the energy source used for charging electric vehicles. However, electricity trade can affect this picture.
An electric vehicle charging in 2021 was using electricity produced by the following sources (highest shares of each energy source in the EU):
- 11.6 % from solar photovoltaics in Malta
- 48.6 % from wind in Denmark
- 60.1 % from hydro in Austria
- 68.4 % from nuclear in France
- 71.1 % from solid fossil fuels in Poland
- 86.1 % from natural gas in Malta
- 84.9 % from oil and petroleum products in Cyprus
Full article
Transport sector data analysis
Total number of passenger electric vehicles (battery only) on the road
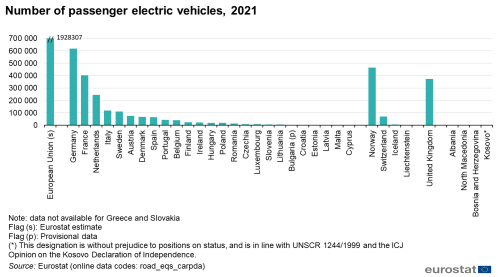
Figure 1 shows the total number of passenger electric vehicles (battery only) on the road per country. It is highest in Germany (618 460), Norway (465 410), France (402 669) and Netherlands (245 091). Data are not available for Greece and Slovakia.
Growth rate of electric vehicles number compared with previous year
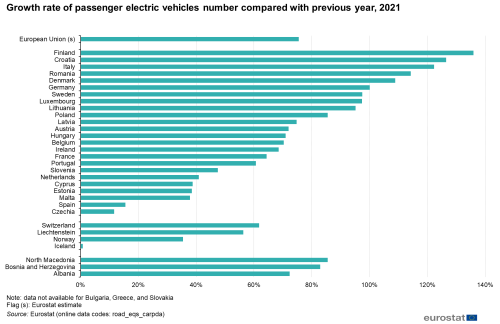
Figure 2 presents the growth rate of electric vehicles. In 2021 compared to 2020, the number of passenger electric vehicles have substantially increased. The largest increase was seen in Finland, Croatia and Italy, with 135.9 %, 126.6 %, 122.4 % respectively. Despite the fact electric vehicles penetration is still comparatively low, their growth rate evolves dynamically.
(%)
Source: (road_eqs_carpda)
Share of electric vehicles in the total number of passenger vehicles
Figure 3 presents the share of electric vehicles in the passenger cars fleet per country. In 2021, Norway, with a strong policy for electric vehicles, stands out with 15.5 %. In the EU, Netherlands and Denmark had the largest share with 2.8 %, and 2.4 % respectively. However, the absolute numbers remain very low for virtually all countries.
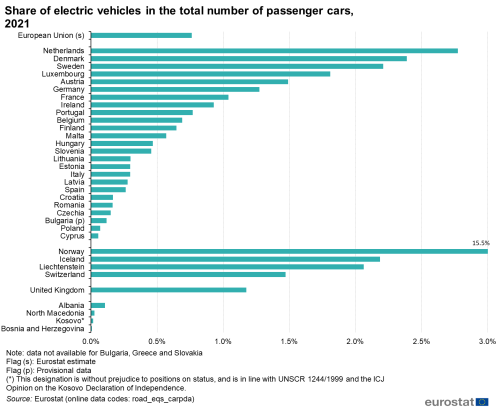
(%)
Source: (road_eqs_carpda)
Electricity sector analysis
Gross electricity production
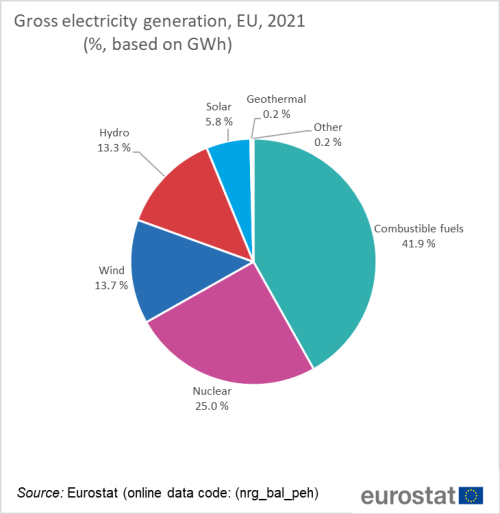
To assess, how “clean” electric vehicles actually are, it is useful to look more closely at how electricity is generated. This is the energy used for their charging. At EU level in 2021 (figure 4), combustible fuels accounted for 41.9 % of the total gross electricity production, wind, hydro, solar and geothermal production corresponded to 33 %, whereas nuclear contributed with 25 %. In several countries, electricity is produced from renewables but in other cases, coal, lignite, natural gas or oil are the main fuels. For example in Iceland, Norway and Sweden, lower than 2% of the electricity used to charge electric vehicles is generated from fossil fuels.
Looking into combustible fuels in detail, figure 5 shows the percentage of gross electricity production from solid fossil fuels in 2021. Poland, Czechia and Bulgaria, with 71.1 %, 40.2 % and 35.9 % respectively, are the countries with the highest percentage of gross electricity production from fossil fuels. Gross electricity production from solid fossil fuels in Sweden, Estonia, Cyprus, Latvia, Lithuania, Luxembourg, Malta, Iceland and Norway is zero or negligible.
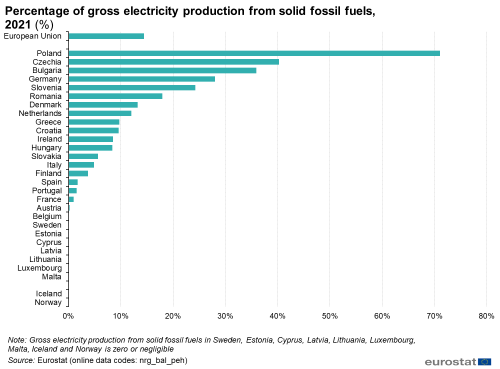
(%)
Source: Eurostat (nrg_bal_peh)
Figure 6 depicts the percentage of gross electricity production from natural gas. In the EU for 2021, the share of gross electricity production from natural gas is 19 %. Malta with 86.1 %, Italy (49.9 %), Ireland (47.6 %) and Netherlands (46.6 %) produce more than 45 % of their gross electricity from natural gas. Gross electricity production from natural gas in Cyprus, Sweden and Iceland is zero or negligible.
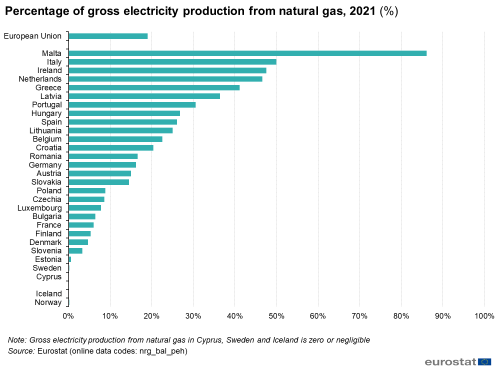
(%)
Source: Eurostat (nrg_bal_peh)
Figure 7 shows the percentage of gross electricity production from oil and petroleum products in 2021. EU countries typically produce a low or negligible percentage of gross electricity from oil and petroleum products. An obvious exception to this is Cyprus, where 84.9 % of gross electricity production comes from oil and petroleum products, as well as to some extent Greece, where this figure stands at 8.5 %. However, this is slowly changing, as the rise in renewables is reducing the need for their use in electricity production.
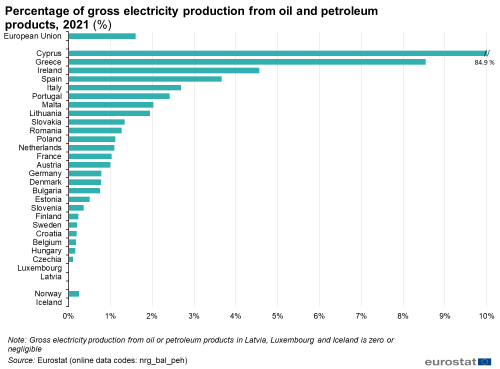
(%)
Source: Eurostat (nrg_bal_peh)
Figure 8 presents the share of nuclear in the gross electricity production in 2021. The thirteen countries that use nuclear energy in their mix are France, Slovakia, Hungary, Belgium, Bulgaria, Sweden, Slovenia, Czechia, Finland, Spain, Romania, Germany and Netherlands. The highest percentage in 2021 was recorded in France, which produced 68.4 % of its gross electricity using nuclear, while the Netherlands, with 3.1 %, had the lowest share of nuclear electricity among the 13 producing countries.
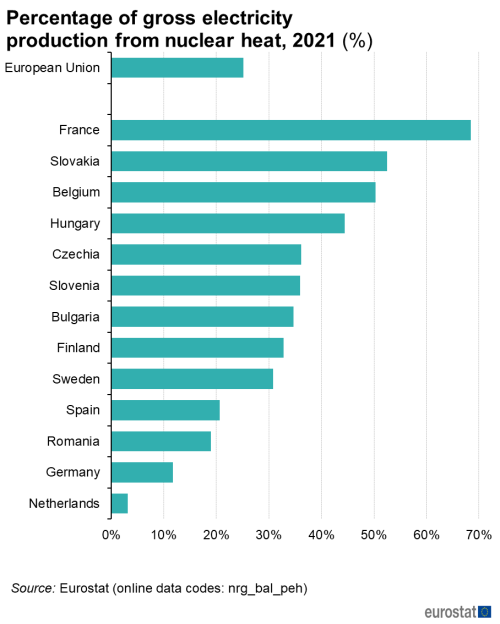
(%)
Source: Eurostat (nrg_bal_peh)
Looking at the renewables, the share of electricity produced from wind in the total gross electricity was highest in Denmark, Ireland and Lithuania in 2021, who reported 48.6 %, 30.7 % and 27.9 % respectively. By contrast, gross electricity production from wind in Slovenia, Slovakia, Malta and Iceland was zero or negligible.
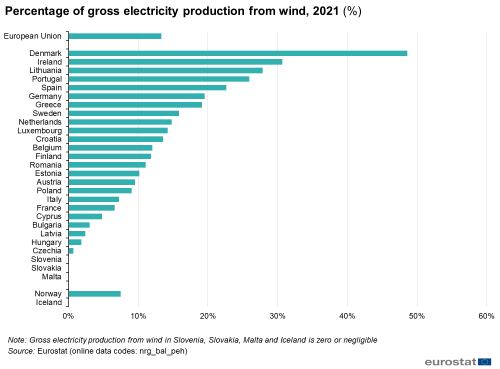
(EUR per kWh)
Source: Eurostat (nrg_bal_peh)
Figure 10 shows the percentage of hydro in gross electricity production in 2021. Austria, Luxembourg and Croatia had the highest percentage with 60.1 %, 49.1 %, 47.5 % respectively. Gross electricity production from hydro in the Netherlands, Denmark, Cyprus and Malta is zero or negligible.
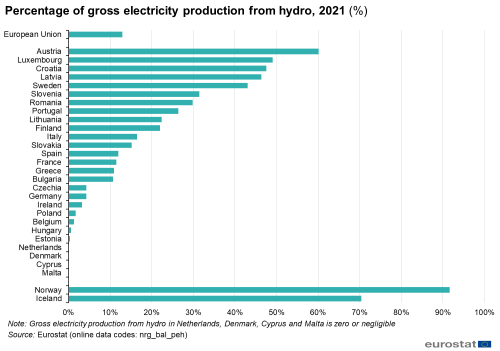
(EUR per kWh)
Source: Eurostat (nrg_bal_peh)
Figure 11 shows the percentage of solar in gross electricity production in 2021. Malta, Hungary and Greece had the highest percentage with 11.6 %, 10.6 %, 9.6 % respectively. The lowest was observed in Latvia (0.1 %), Ireland (0.3 %) and Finland (0.4 %). Gross electricity production from solar photovoltaics in Iceland is zero.
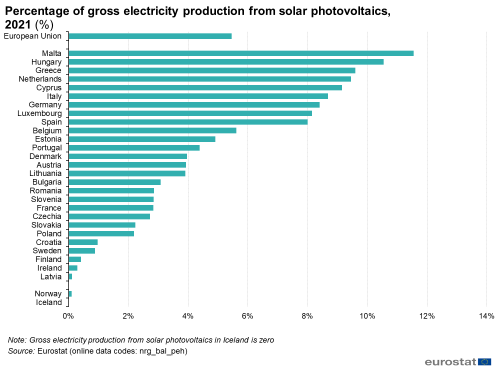
(EUR per kWh)
Source: Eurostat (nrg_bal_peh)
Electricity consumption in road transport
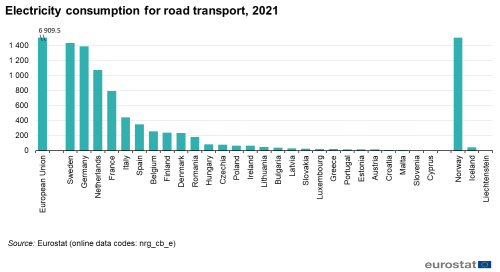
When referring to electricity consumption in road transport, we include the electricity used for charging electric vehicles, as well as the electricity consumed by electric trolley buses. Data and methodology are under development. In absolute terms for 2021, first is Norway, where 1 523 GWh are mostly used for charging electric vehicles. Sweden and Germany follow with the consumption of 1 433 GWh and 1 386 GWh respectively, mostly for electric vehicles charging.
Source data for tables and graphs
Context
In 2016, the European Commission presented the European Strategy for Low-Emission Mobility COM2016(501) final. The Commission identified low-emission mobility as an essential component of the broader shift to the low-carbon, circular economy needed Europe to stay competitive and be able to cater to the people and goods mobility needs.
The Fit for 55 legislative proposals cover a wide range of policy areas including climate, energy, transport and taxation, setting out the ways in which the Commission will reach its updated 2030 target in real terms.
REPowerEU Plan looks into accelerating the transition towards zero-emission vehicles. The Commission considers a legislative initiative to increase the share of zero emission vehicles in public and corporate car fleets above a certain size. The EU Save Energy Communication also includes many recommendations to cities, regions and national authorities that can effectively contribute to the substitution of fossil fuels in the transport sector. In 2023, Commission recommendations on how to exploit the potential of Energy storage gives emphasis to the potential of electric vehicles for energy storage.
Direct access to
Other articles
Dedicated section
Methodology
- Energy statistics - quantities (nrg_quant) (ESMS metadata file — nrg_quant_esms)
