Archive:Employed people and job starters by economic activity and occupation
Data extracted in February 2022
Planned article update: April-May 2022
Highlights
In 2020, the outbreak of the COVID-19 pandemic and the induced crisis led to a more cautious policy from enterprises with regards to hiring new people. Furthermore, one might expect more reluctance from people to start new businesses, which could have led to more employment in other circumstances. This, among other reasons, caused a downward trend in employment rates. In the year 2021, especially in the second and third quarters, the labour market began its revival, following the partial or full relief of some of the anti-pandemic measures taken to combat the spread of the disease.
The objective of this article is to study the employment dynamics by looking at the people who have started their job recently. Recent job starters (new or recently employed people) are defined as people who reported that they started their current job in the last 3 months before the interview. Findings on this sub-population of employed people are presented for different sectors of the economy (NACE Rev. 2) and groups of occupation (ISCO-08). Hereby, conclusions can be drawn on which economic sectors and occupations expanded or stagnated in terms of hiring or attracting new people.
Results are based on the European Union Labour Force Survey (EU-LFS) quarterly results, mainly for the second quarter of 2021. Given the level of detail, the data used in this article are not seasonally adjusted. The European and country approaches are presented, in order to show the employment dynamics at the global EU level and at the national level in the individual Member States, as well as in two EFTA countries (Iceland and Switzerland) and one candidate country (Serbia).
This article is part of the online publication Labour market in the light of the COVID 19 pandemic - quarterly statistics.
Full article
Spotlight on economic activities
At EU level, during the third quarter of 2021 (Q3 2021), the different economic activities attracted new employed people disproportionately compared with their size in terms of employment (see Figure 1). The greatest difference was found in the sector of accommodation and food services, which accounted for 4.3 % of employment and 12.3 % of recent job starters. Reversely, the share of the industry was higher among employed people than among recent job starters (18.2 % versus 13.0 %); a similar situation was observed for the sector of public administration and defence (7.3 % versus 4.0 %). These imbalances resulted in a high disparity of the share of recent job starters in employment, which ranged from more than one in ten (exactly 12.3 %) employed people being recent job starters in accommodation and food service activities to less than 4 % in the sectors professional, scientific and technical activities (3.6 %), education (3.3 %), industry (3.1 %), financial, insurance and real estate activities (2.8 %) and public administration and defence (2.3 %).
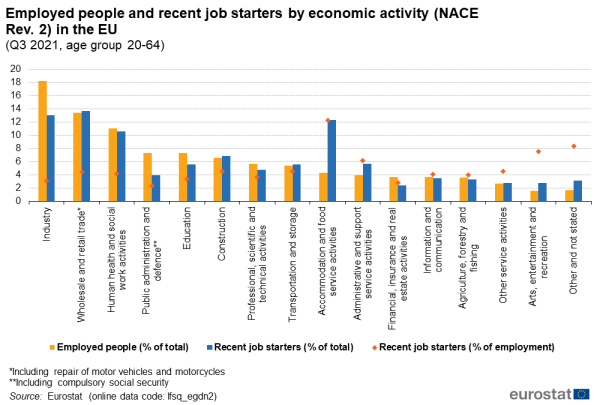
Source: Eurostat (lfsq_egdn2)
Regarding the total employed population, the sectors with the highest shares of employed people, in descending order, were as follows: industry (18.2 %), wholesale and retail trade (13.4 %), human health and social work activities (11.0 %), public administration and defence and education (both 7.3 %). In contrast, sectors of other service activities and arts, entertainment and recreation held the smallest proportion of employment, less than 3 %. Shifting the focus onto the distribution of recent job starters, wholesale and retail trade (13.6 %) and industry (13.0 %) also landed at the top of the ranking with the highest shares among recent job starters, however, this time followed by accommodation and food services (12.3 %) and human health and social work activities (10.6 %).
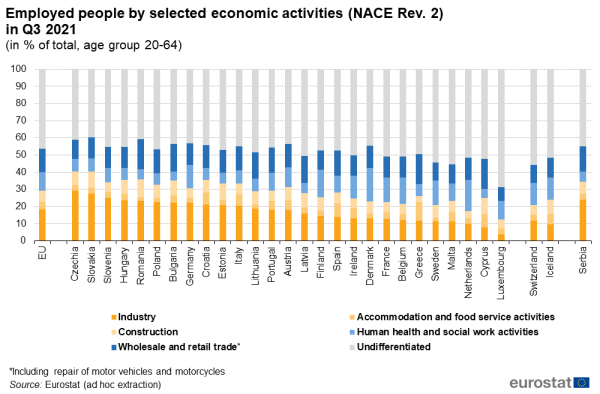
Figures 2 and 3 show the distribution of employed people and recent job starters by a selection of economic activities - industry, accommodation and food service activities, construction, human health and social work activities and wholesale and retail trade - which together represent roughly around half of the employment in most of the countries.
As it can be seen, the profile of EU countries varies a lot according to the proportion of these sectors. In the sector of industry, were employed more than one-fourth of total employed people in Czechia, Slovakia and Slovenia, but less than one-tenth of employed people in the Netherlands, Cyprus and Luxembourg. EU countries also showed large differences regarding the employed people in the sector of human health and social work, where was working one in seven employed people in Denmark, the Netherlands, Finland, Belgium and Sweden, but less than 7 % of employed in Croatia, Greece, Hungary, Poland, Estonia, Latvia, Romania, Bulgaria and Cyprus. Overall, Northern and Western countries showed a larger share of employed people in the sector of human health and social work than Eastern and Southern countries.
In the same way, as for the global EU level, among the EU countries, the distribution of recent job starters by economic activity was not the same as for the total employed people. This difference can be observed the most clearly for the sector of accommodation and food service activities. Firstly, among all Member States with available data for this sector for both employed people and recent job starters (21 countries in total), the share of accommodation and food services was higher among recent job starters than among the total employed population. The starkest example here can be found in Greece, where 45.3 % of recent job starters had taken jobs recently in accommodation and food services, at the same time in this sector were employed 10.8 % of total employed people. Still focusing on this sector, Croatia, Italy and Cyprus also stood out with significantly larger differences - respectively 19.9 %, 20.9 % and 23.0 % of recent job starters had begun jobs in accommodation and food services, compared with 6.9 %, 6.5 %, and 7.5 % of the total employed population being occupied in this sector.
Taking a look at the other sectors, significant differences between the distribution of recent job starters and that of total employment can be also seen for the sector of construction in Romania (25.7 % of recent job starters versus 10.5 % of total employment), Lithuania (14.5 % versus 7.6 %) and Bulgaria (14.6 % versus 8.6 %). Also, for the sector of wholesale and retail trade in Lithuania (24.6 % versus 15.3 %).
As opposed to accommodation and food services, the industry sector attracted a smaller percentage of recent job starters in comparison with the size of this sector in total employment. This pattern can be observed in all EU countries with available data, with the exception of Portugal. This difference was most obvious in Slovakia (17.1 % of recent job starters versus 27.5 % of employed people) and Bulgaria (12.5 % versus 22.1 %).
Spotlight on occupational groups
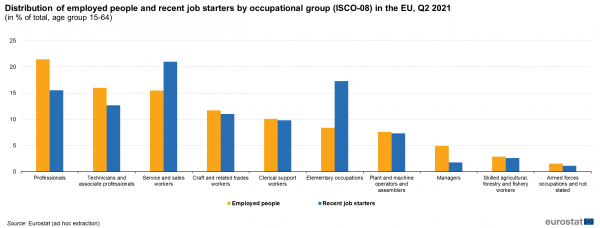
Similarly to the sectors of economic activities, the distributions of recent job starters and total employment by occupational groups show large differences between each other (see Figure 4). Elementary occupations represented 8.4 % of employment in Q2 2021 at EU level and at the same time 17.3 % of recent job starters. Moreover, the group of people with elementary occupations was the second-largest among job starters. In the same way, service and sales workers amounted for 15.5 % of total employment but 21.0 % of recent job starters, being the first largest group among the new workers. The opposite situation was observed for the group of professionals, representing 21.5 % of the employed population, the largest group, but 15.5 % of recent job starters, being the third-largest group among the new workers.
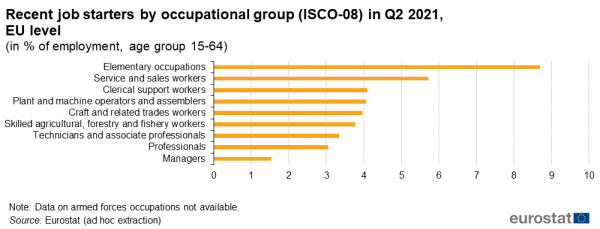
In addition, recently employed people represented 8.7 % of the total employed people having an elementary occupation in Q2 2021 at EU level, representing the group with the largest share of recent job starters. Following the workers with elementary occupations, service and sales workers (5.7 %), clerical support workers and the plant and machine operators and assemblers (both with 4.1 %) were the groups with the most new people among the total employment, as shown in Figure 5. The same groups also had the highest shares of new employed in the previous quarter (i.e. Q1 2021). In contrast, the groups of professionals (3.0 %) and managers (1.5 %) had the lowest percentages of recently employed people in Q2 2021.
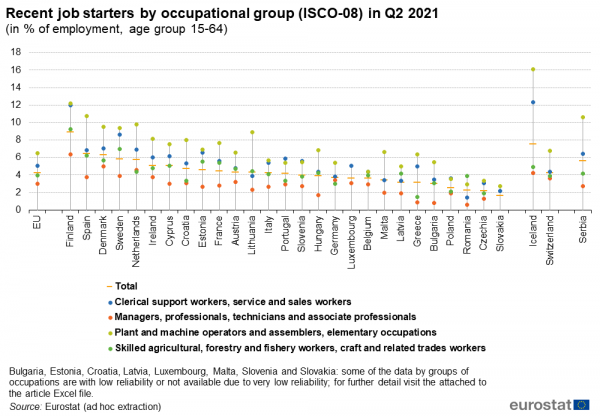
In 20 out of 24 EU countries for which data was available for all broader groups of occupation, the group of plant and machine operators and assemblers and workers with elementary occupations was the group with the highest share of recent job starters among the total employment (see Figure 6). The share of recently employed people in this group ranged from more than 10 % in Finland (12.2 %) and Spain (10.8 %) to less than 3 % in Romania (2.9 %) and Slovakia (2.7 %).
Portugal (5.9 %), Slovenia (5.6 %) and Poland (3.6 %) had the highest share of recent job starters in the group of clerical support workers, service and sales workers. Romania (3.9 %) had the highest share of starters among the group of skilled agricultural, forestry and fishery workers, craft and related trades workers. Finally, Belgium (4.4 %) had equal shares among clerical support workers, service and sales workers, as well as among plant and machine operators and assemblers, elementary occupations.
In the vast majority of EU countries (22 out of 24 with data for all groups), the group encompassing managers, professionals, technicians and associate professionals had the lowest share of new employed people among the total employment. The Netherlands and Germany were exceptions to this pattern, with lower percentages found among the skilled agricultural, forestry and fishery workers, craft and related trades workers. Finland (6.4 %), Denmark (5.0 %) and the Netherlands (4.6 %) recorded the highest shares of new workers among the group of managers, professionals, technicians and associate professionals. At the end of the ranking, the lowest proportions were found in Greece, Bulgaria and Romania (less than 1 % in all three).
Source data for tables and graphs
Data sources
All figures in this article are based on quarterly results from the European Union Labour Force Survey (EU-LFS).
Source: The European Union Labour Force Survey (EU-LFS) is the largest European household sample survey providing mostly quarterly and annual results on labour participation of people aged 15 and over as well as on persons outside the labour force. It covers residents in private households. Conscripts in military or community service are not included in the results. The EU-LFS is based on the same target populations and uses the same definitions in all countries, which means that the results are comparable between countries.
Definitions: Recent job starters (new or recently employed people) are defined as people who reported that they started their current job in the last 3 months before the interview. Information on the methodological aspects in defining the year and month in which a person started working for the current employer or as self-employed in current main job, used in distinguishing the category of recent job starters, can be found on pages 167-169 of the latest explanatory notes.
European aggregates: EU refers to the sum of the EU-27 Member States. If data is unavailable for a country, the calculation of the corresponding aggregates is computed with estimates. Such cases are indicated.
Country note: Spain and France have assessed the attachment to the job and included in employment those who have an unknown duration of absence but expect to return to the same job once the COVID-19 measures in place are lifted.
Coverage: The industry sector encompasses ‘mining and quarrying’, ‘manufacturing’, ‘electricity, gas, steam and air conditioning supply’ and ‘water supply, including sewerage, waste management and remediation activities’; Information on the share of recent job starters is presented only for the sectors of the economy, which represent more than 1 % of employment.
Eight different articles on detailed technical and methodological information are available from the overview page of the online publication EU Labour Force Survey. Detailed information on coding lists, explanatory notes and classifications used over time can be found under documentation.
Context
The COVID-19 pandemic hit Europe in January and February 2020, with the first cases confirmed in Spain, France and Italy. COVID-19 infections have been diagnosed since then in all European Union (EU) Member States. To fight the pandemic, EU Member States have taken a wide variety of measures. From the second week of March 2020, most countries closed retail shops, with the exception of supermarkets, pharmacies and banks. Bars, restaurants and hotels were also closed. In Italy and Spain, non-essential production was stopped and several countries imposed regional or even national lock-down measures which further stifled economic activities in many areas. In addition, schools were closed, public events were cancelled and private gatherings (with numbers of persons varying from 2 to over 50) banned in most EU Member States.
The majority of the preventive measures were initially introduced during mid-March 2020. Consequently, the first quarter of 2020 was the first quarter in which the labour market across the EU was affected by COVID-19 measures taken by Member States.
In the following quarters of 2020, as well as 2021, the preventive measures against the pandemic were continuously lightened and re-enforced in accordance with the number of new cases of the disease. New waves of the pandemic began to appear regularly (e.g. peaks in October-November 2020 and March-April 2021). Furthermore, new strains of the virus with increased transmissibility emerged in late 2020, which additionally alarmed the health authorities. Nonetheless, as massive vaccination campaigns started all around the world in 2021, people began to anticipate improvement of the situation regarding the COVID-19 pandemic.
The quarterly data on employment allows to regularly report on the impact of the crisis due to the COVID-19 pandemic on employment. This specific article focuses on the employed people and job starters by sector of economic activity and occupation. Another article depicts employment in general and specifically by gender, age and level of educational attainment; it moreover provides results on the temporary contracts and part-time work and presents for the first time quarterly employment rates for the first and second generations of migrants.
Please note that in this exceptional context of the COVID-19 pandemic, employment and unemployment as defined by the International Labour Organisation (ILO) are not sufficient to describe the developments taking place in the labour market. In the first phase of the crisis, active measures to contain employment losses led to absences from work rather than dismissals, and individuals could not look for work or were not available due to the containment measures, thus not counting as unemployed. Only referring to unemployment might consequently underestimate the entire unmet demand for employment, also called the labour market slack, which is further analysed, with namely the evolution of the total volume of working hours, in the publication Labour market in the light of the COVID-19 pandemic.
Direct access to
See also
Main tables
Database
Dedicated section
Publications
- Labour force survey in the EU, EFTA, United Kingdom and candidate countries — Main characteristics of national surveys, 2019, 2021 edition
- Quality report of the European Union Labour Force Survey 2019, 2021 edition
- Labour market in the light of the COVID 19 pandemic — online publication
- EU labour force survey — online publication
- European Union Labour force survey - selection of articles (Statistics Explained)
Methodology
Publications
- EU labour force survey — online publication
- Labour force survey in the EU, EFTA, United Kingdom and candidate countries — Main characteristics of national surveys, 2019, 2021 edition
- Quality report of the European Union Labour Force Survey 2019, 2021 edition
ESMS metadata files and EU-LFS methodology
- Employment and unemployment (Labour Force Survey) (ESMS metadata file — employ_esms)
- LFS series - detailed quarterly survey results (from 1998 onwards) (ESMS metadata file — lfsq_esms)
- LFS series - detailed annual survey results (ESMS metadata file — lfsa_esms)
- LFS ad-hoc modules (ESMS metadata file — lfso_esms)
- LFS main indicators (ESMS metadata file — lfsi_esms)
- LFS regional series (ESMS metadata file — reg_lmk)
